![]()
The editor can help you explore and analyze data; for more information, see section Exploring and Analyzing Data in the Ad Hoc Editor.
This section discusses some of the editor’s basic functionality, including:
• Selecting the Content of a Report
• Formatting the Appearance of a Table
• Viewing and Running a Report in the Editor
|
|
The editor can help you explore and analyze data; for more information, see section Exploring and Analyzing Data in the Ad Hoc Editor. |
In the following example, you create a table that shows the ship date and shipping charge of orders; this table is used to analyze whether combining shipments reduces costs.
|
|
While the example in this section is based on a JRXML Topic, the concepts and procedures apply more broadly to Domains and Domain Topics when used as the basis of Ad Hoc reports. |
To design a table in the Ad Hoc Editor:
| 1. | After logging into JasperReports Server, click Create > Ad Hoc Report: |
![]()
The Data Chooser lists Topics or Domains to use as the data source for the report.
|
|
|
Data Chooser |
| 2. | From the Topics list, select demo for adhoc and click Table. |
|
|
The location of this Topic, typically in Ad Hoc Components > Topics, depends on your system configuration. |
The Ad Hoc Editor appears.
|
|
|
New Report in the Ad Hoc Editor |
| 3. | In Fields, Ctrl-click the following fields and drag them to the canvas: |
|
Date ordered |
Name |
Shipped via |
|
|
You can also double-click a field to put it on the canvas. The field context menu also provides the option to add fields. |
The columns of data appear on the canvas in the order you choose them. The Shipped Via column displays a list of numbers that seem irrelevant.
| 4. | Remove the Shipped Via column from the table: Select the column, right-click, and choose Remove from Table. |
| 5. | In Fields, right-click the City field, and select Add as Group from the context menu. |
The canvas refreshes and displays the selected data grouped by city.
| 6. | In Fields, select Country and drag it to the Group Control icon |
The canvas refreshes and displays the data grouped by both city and country.
|
|
The order in which you add fields to the report determines the order of groups. You can change the order if it doesn’t make sense. |
| 7. | Right-click the top-most Country heading and choose Move Up from the context menu. |
The canvas refreshes and displays the rows grouped by country and then city. With the new ordering, the editor displays rows that describe stores in Argentina.
| 8. | Review the data in the Buenos Aires group. The rows are mixed; some show data for Cactus Comidas por llevar, and others show data for Rancho grande or Océano Atlántico Ltda. |
| 9. | Right-click the Name column and choose Remove from Table. |
| 10. | In Fields, right-click Name and select Add as Group from the context menu. |
The canvas refreshes and displays the data grouped by country, city, and name.
| 11. | On the canvas, right-click the Shipping Charge column and select Add Summary from the context menu. |
The Ad Hoc Editor displays the totals (sum) for each name, city, and country. Using a context menu, you can change or remove the summary function.
|
|
|
Unformatted Table |
| 12. | Near the top of the canvas, click Chart to view the data as a bar chart. |
| 13. | Right-click the chart and select Change Chart Type > Pie to view the data as a pie chart. |
| 14. | Near the top of the canvas, click the Table tab to return to the table view. |
| 15. | Click Full Data to include the entire dataset in the table. |
The total for Argentina changes from $597.00 to $600.00 when the report uses the full set of data.
|
|
By default, Sample Data is selected in the Editor. By default, the server loads only a subset of the data from the data source into a table or crosstab. Working with the full set of data gives you a better understanding of the final report; however, working with a subset of the data may improve the performance of the Ad Hoc Editor. It is easier to work with summaries in tables using sample data because you can use a summary context menu at the bottom of the column. |
| 16. | Place the cursor over |
| 17. | In the Name field, enter Ad Hoc Demo Report. |
| 18. | In the Description field, enter This report was created with the Ad Hoc Editor. |
| 19. | Select a folder for saving the report, and click Save. |
The default location depends on the permissions granted to your user account.
You have created a basic report that shows the date shipped and shipping charge recorded for orders in the sample data.
Next you’ll edit the table created in the last example to change its appearance.
|
|
You can use the Ad Hoc Editor to edit reports created in the Ad Hoc Editor only, not iReport. |
To format a table in the Ad Hoc Editor:
| 1. | Click View > Search Results. |
| 2. | In the Search field, enter ad hoc demo and click |
The Search results appear, displaying objects that match the text you entered.
| 3. | Right-click the Ad Hoc Demo Report and select Open in Designer from the context menu. |
![]()
|
|
The Open in Designer submenu opens a Ad Hoc report or a dashboard for editing in the Ad Hoc Editor or dashboard, respectively. |
The Ad Hoc Demo report appears.
| 4. | At the top of the Fields panel, click |
|
|
All report data and formatting are lost when you select a new Topic or Domain. Any changes to the report are also lost if you navigate to another page using the browser navigation buttons, the main menu, or the Search field. To preserve changes, accept the current Topic or click Cancel. |
| 5. | Click Cancel to return to the editor without changing the Topic. |
| 6. | Above the table, click the text Click to add a title. |
The title becomes editable.
| 7. | Enter Orders and Fees by Customer. |
| 8. | Click |
The Styles window appears: 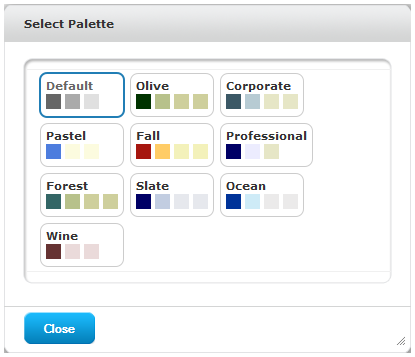
| 9. | Select the Ocean style and click Close. |
| 10. | On the canvas, right-click the first Name group (Cactus comidas por llevar) and select Edit Label from the context menu: 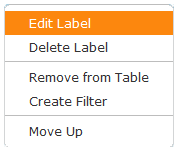 |
The Edit Label window appears ready to change the Name label.
| 11. | In Edit Label, delete Name and enter Customer for the group label, and click Submit. |
| 12. | Right-click the Date ordered column and select Edit Label from the context menu. |
The column label becomes editable. Type Ordered on as the new label. Click Submit. Enter new labels for these columns as well:
Date shipped – Shipped on
Shipping charge – Fee
| 14. | Right-click the Postal code column and click Delete Label from the context menu. Resize the column again until it is as narrow as the data. |
If space is at a premium, you can remove labels from the report and make the column only as wide as the data. The label isn’t displayed when you run the report; it is displayed only in the editor.
The last few columns are now difficult to read because they are crowded together. Adding some space might help.
| 15. | In Fields, select Spacer and drag it into the table between two columns. A spacer column, labeled |
| 16. | Spacers can also be used to create margins. Select Spacer again and drag it to left edge of the table. |
| 17. | Drag Spacer to the right edge of the table. |
| 18. | Right-click the Fee column, select Change Data Format, and click Change Data Format > ($1,234.56). |
The U.S. Dollars data format is applied to the Fee column.
| 19. | Right-click the Ordered on column, click Change Data Format, and select the short date format, for example, 5/01/08. Apply the short date format to the Shipped on column. |
The dates in the columns now appear in the short date format.
| 20. | Use Ctrl-click to select both the Order ID field and the spacer to its right. |
| 21. | Drag the field and spacer to the left-most position in the report and drop them. |
| 22. | Place the cursor over |
The Ad Hoc Editor applies a summary to each field depending on its datatype and inserts a spacer in the leftmost position to improve the table’s formatting.
| 23. | Display the detail rows again from the |
| 24. | Place the cursor over |
| 25. | Place the cursor over |
You have now created and formatted an Ad Hoc report:
|
|
|
|
Any unused space at the right of the report area is retained when you run the report. |
After you create a compelling table, chart, or crosstab, save it in the repository for future use. Before leaving the editor, you can see how the report will look to users:
• View the report in presentation mode by clicking ![]() .
.
• Run the report by clicking ![]() ; you can also run the report directly from the repository, as described in Running a Simple Report. When you run the report, it is displayed as a JasperReport.
; you can also run the report directly from the repository, as described in Running a Simple Report. When you run the report, it is displayed as a JasperReport.


