![]()
Multiple controls are those used by more than one report. Single controls are those used by a single report.
As a user, you can create a dashboard, though your permissions to access the repository may limit the content you can add and the location where you can save the dashboard.
• Adding Controls to a Dashboard
• Adding a Custom URL to a Dashboard
• Refining a Dashboard’s Layout
• Tips for Designing Dashboards
A dashboard can include the following content:
• Reports in the repository.
• Special content:
• Custom URL. Any URL-addressable web content. The dashboard can point to web content and include it in a frame in a web page. For example, you might include a frame that points to the logo on your corporate website; when that logo changes, the dashboard automatically updates to reflect the branding change. A complex example is described in See "Creating a Dashboard".
• Free Text. A free-form text entry field. Resizing this type of item changes the size of the font in the label. Use free text items to add titles and instructional text to the dashboard.
• Single Controls and Multiple Controls. If a report you include on the dashboard is designed to use input controls or filters, you can add that capability to the dashboard. The server maps input controls to one or more frames. For example, if multiple reports include the same parameter, the server automatically maps the corresponding control to each of those reports when you add the input control to the dashboard. Controls can also be manually mapped to custom URL frames.
|
|
Multiple controls are those used by more than one report. Single controls are those used by a single report. |
• Dashboard Controls:
Submit. Applies the values in the dashboard input controls to the reports that refer to each input control. The server refreshes these reports to display the new set of data. If the dashboard doesn’t include a Submit button, changes to input control values are reflected immediately.
Reset. Resets the values of the input controls to the last value selected when the dashboard was saved.
Print View. Displays the dashboard without buttons or the server’s header and footer, and (depending on the browser) opens the browser’s Print window.
Text Label. Identifies an input control. When you add an input control to the dashboard, the server automatically adds a text label for it. Resizing this type of item only changes the size of the label itself; the font size in the label is fixed.
This section describes the creation of a dashboard.
|
|
To add a report to a dashboard, you must have permission to view the report. |
To create a simple dashboard:
| 1. | Click Create > Dashboard.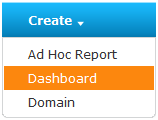 |
The dashboard designer appears, displaying the list of available content and the canvas.
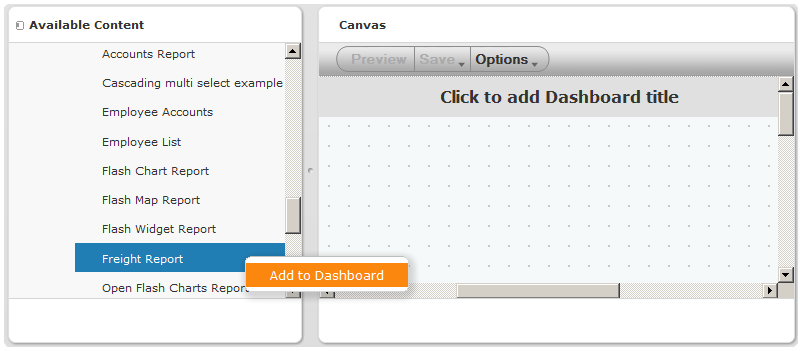
| 2. | In Available Content, navigate to the /Reports/Samples folder, right-click the Freight Report. |
| 3. | Select Add to Dashboard: |
|
|
|
List of Available Content in the Dashboard Designer |
The Freight Report appears in a frame in the upper left corner of the canvas.
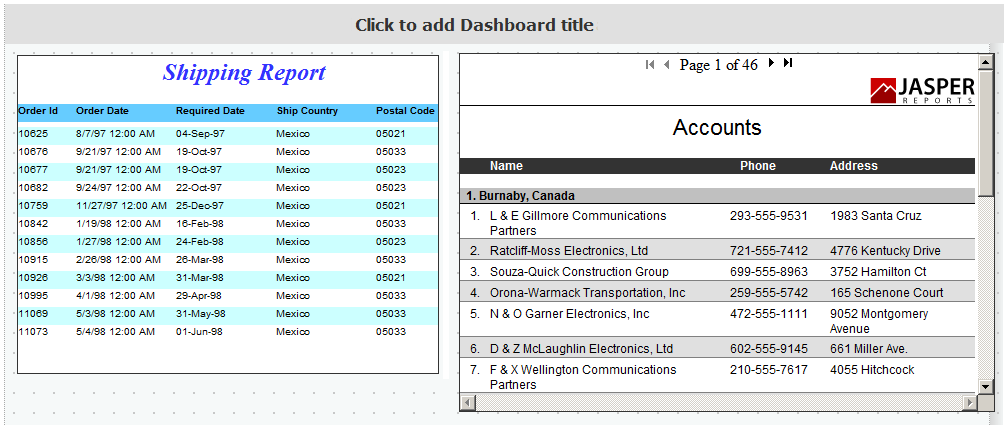
| 4. | In Available Content, double-click the Accounts Report. |
The Accounts Report appears on the canvas.
| 5. | Right-click the Accounts Report and click Size to Content. |
The resized Accounts Report now exceeds the canvas area.
|
|
You can save the dashboard even though its contents exceed the canvas area. In fixed sizing mode, if content exceeds the canvas area, the user may have to scroll to see the entire dashboard. |
| 6. | To ensure that a user with the selected resolution can view the entire dashboard without scrolling, resize the Accounts Report to fit within the canvas area: |
Hover the cursor over the handle at the bottom of right-hand edge of the frame containing the Accounts Report.
| a. | When the cursor changes to a resizing icon ( |
| b. | Drag the edge of the frame of the Accounts Report upward until only seven accounts in Burnaby are shown. |
|
|
Press the Ctrl key while dragging or resizing items and frames for smoother cursor movement. This disables the default snap-to-grid behavior. |
| 7. | Right-click the Accounts Report and click Show Scroll Bars. |
| 8. | Right-click the Freight Report, and click Hide Scroll Bars. |
|
|
Use Hide Scroll Bars for charts and small crosstabs to size the frame to match its content exactly. |
See "A Simple Dashboard with Sample Reports" shows how the dashboard looks at this point:
|
|
| 9. | Click Preview. |
The end user view of the dashboard appears in a new tab or a new window, depending on the browser configuration.
| 10. | Close the preview window or tab to return to the designer, and click Save Dashboard. |
You are prompted for the name and location for saving the dashboard.
| 11. | Change the default name, New Dashboard to Freight Dashboard and locate a folder, such as the /Dashboards folder. |
Because the Freight Report has input controls that you can use to change report output, you can add those controls to the dashboard.
To add controls to the dashboard:
| 1. | If the Freight Dashboard created in section See "Creating a Simple Dashboard" is not open, locate the /Dashboards folder in the repository. Right-click the dashboard name and select Open in Designer from the context menu. |
|
|
The Open in Designer submenu opens a dashboard or an Ad Hoc report for editing in the Dashboard Designer or Ad Hoc Editor, respectively. |
The Freight Dashboard appears in the designer, as shown in See "A Simple Dashboard with Sample Reports".
| 2. | In the Available Content list, open the Special Content > Single Report Controls folder. |
The three input controls associated with the Freight Report appear.
| 3. | Right-click Country and select Add to Dashboard. |
The Country input control and its label appear above the Freight Report on the canvas.
|
|
If you want to place the input control in a location other than above the report, drag it from the Available Content list to the desired location. You can delete, reposition, and resize the input control or its label independently. |
| 4. | Select a new value from the Country input control. |
The data displayed in the Freight Report changes, but not in the Account report. The Account report does not refer to an input control named Country.
| 5. | Add the OrderID and RequestDate controls to the dashboard. In the Available Content list, right-click RequestDate, and select Add to Dashboard. Right-click OrderID, and select Add to Dashboard. |
| 6. | Ctrl-click to select the input controls and their labels. |
|
|
You can use a selection rectangle or Ctrl-click to select multiple frames and items on the canvas. |
| 7. | Drag the controls below the Freight Report. |
| 8. | Draw a selection rectangle to select the OrderID input control and its label, and drag them directly beneath the Country input control. |
| 9. | Draw a selection rectangle to select the RequestDate input control and its label, and drag them directly beneath the OrderID input control. |
| 10. | Click the OrderID label, and change it to Order.Change the RequestDate label to Date. |
| 11. | In the Available Content list, navigate to Special Content > Dashboard Controls, and drag the Submit and Reset buttons underneath the input controls on the canvas. |
| 12. | Click Save. |
The dashboard is saved to the repository.
You can create a frame that displays URL-addressable content. Such mashups can help you leverage data from many sources in a single, integrated view. By default, the server assumes that you want to use the HTTP protocol for custom URL frames. However, you can specify that it use the FILE protocol by entering file:// at the beginning of the value in the URL. In this case, the server uses the FILE protocol, and looks for the file you specify in the server’s WEB-INF directory. This is helpful for including images.
To add a custom URL:
| 1. | If the dashboard you saved in section See "Adding Controls to a Dashboard" isn’t open, locate the Freight Dashboard, typically in the /Dashboards folder, right-click Freight Dashboard, and select Open in Designer from the context menu. |
The Freight Dashboard appears in the designer, as shown in See "A Simple Dashboard with Sample Reports".
| 2. | In the Available Content list, select Special Content > Custom URL. |
The Custom URL dialog box appears.
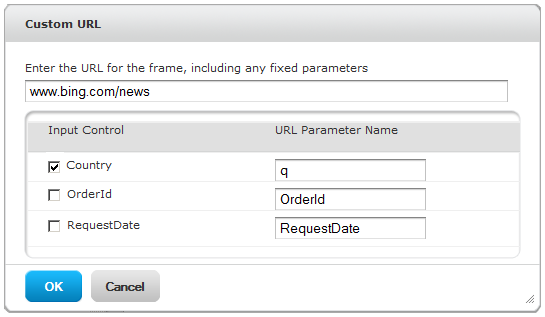
| 3. | Enter the URL of the web page you want the frame to display. For example, enter www.bing.com/news: |
|
|
|
Custom URL Frame Definition |
| 4. | Click the check box next to Country to select that input control, and in theURL Parameter Name field, replace the default text (Country) with the letter q. |
|
|
This URL Parameter Name field is case-sensitive. |
The server maps the Country input control to Bing’s q (query) parameter.
The OrderID and RequestDate input controls also appear in the Custom URL dialog box. If www.bing.com/news accepted a parameter that was compatible with these input controls, you could check their check boxes to associate the URL with these input controls, as well.
|
|
The Custom URL dialog box uses the iframe HTML tag to define an inline frame that can contain a document. If you experience a problem using the Custom URL, check the following possible causes:
|
| 5. | Click OK to close the custom URL dialog box. |
| 6. | Select a new value from the Country input control, click Submit. |
The server passes the Country value to www.bing.com/news, displaying the news related to the selected country. The news displayed in the custom URL frame changes.
| 7. | Resize the custom URL frame so that only the first article’s synopsis appears. |
| 8. | Drag the custom URL frame to the left to align its left edge with the right edge of the input controls. |
|
|
Use the arrow keys to move selected content one grid space at a time. Press the Ctrl key to move the selected content a single pixel at a time. |
| 9. | Click the custom URL frame, and click Auto-refresh Interval on the context menu. |
The menu expands to display options for how frequently the server should refresh the frame’s content. Smaller values make the server update the frame more often. By default, a frame is never automatically refreshed (that is, its Auto-refresh Interval is set to Manual Only).
| 10. | Click 5 Minutes beneath the Auto-refresh Interval on the context menu. |
Auto-refresh affects only the end user view of the dashboard. In the designer, the frame is never auto-refreshed.
| 11. | Click Save. |
The dashboard is saved to the repository.
After completing the layout, refine the look and feel of the dashboard.
To refine the dashboard’s layout:
| 1. | If it isn’t open, locate the Freight Dashboard saved in section See "Adding a Custom URL to a Dashboard", typically in the /Dashboards folder. |
| 2. | Right-click the dashboard name and select Open in Designer from the context menu. |
| 3. | Click Preview. |
The end user’s view of the dashboard appears.
|
|
If the dashboard is already open in the browser, the server updates that page rather than opening a new window or tab. |
| 4. | In the Country field, select a new value. |
The Freight Report and custom URL frames do not update because the dashboard includes the Submit button.
| 5. | Return to the dashboard designer and, on the canvas, hover the cursor over the Submit button. Click the hover border when it appears. |
| 6. | From the context menu, click Delete Item. |
The Submit button disappears.
| 7. | Reposition the Reset button to center it in the available space. |
| 8. | Click Click to add dashboard title. |
The title becomes editable.
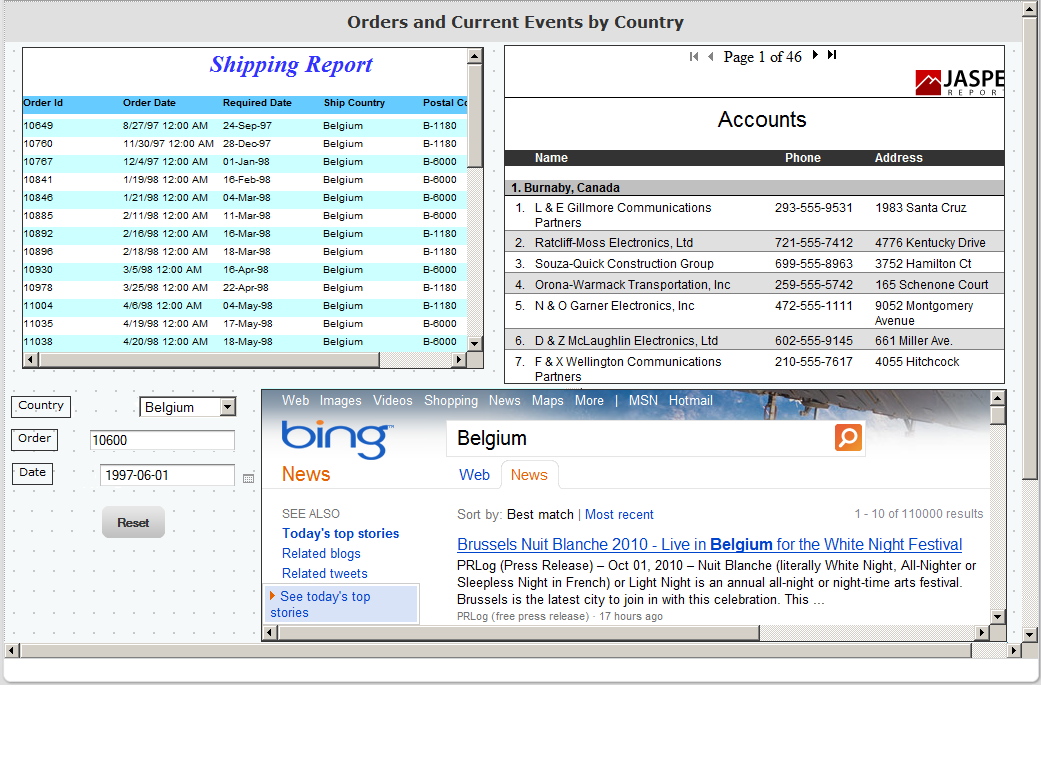
| 9. | Enter Orders and Current Events by Country. |
| 10. | Click Preview. |
The end user view of the dashboard appears.
| 11. | Change the value in the Country input control. |
The dashboard reflects the change immediately:
|
|
|
Dashboard with Sample Reports and Special Content |
| 12. | Return to the dashboard designer and click Save. |
The dashboard is saved to the repository.
When you create or edit a dashboard, keep these tips in mind:
• Alignment of items:
• You can use the computer’s arrow keys to move selected content one grid space at a time.
• Press the Ctrl key to move the selected content a single pixel at a time.
• Selection of items:
• The items on the context menu change depending on your selection. For example, the context menu might include the Delete Item or Delete Frame option, depending on whether you selected a button or a frame.
• If you select multiple items or frames, the context menu includes only options that apply to all selected items. For example, if you select a frame and a button, the context menu includes only the Delete Items option.
• When you select multiple frames, the context menu includes several options that can apply to the frames as a group, such as Hide All Scroll Bars and Delete Items.
• Select multiple frames to change their sizes all at once. When you drag the edge of one frame, the other frames resize as well.
• Relocated or deleted reports in dashboards:
• When you delete a report with input controls from the dashboard, the controls are also deleted, but their labels remain. Delete labels manually.
• If a custom URL frame is mapped to a deleted input control, the server shows the default URL but does not pass the parameter.
• Keep track of reports used in dashboards to prevent inadvertent deletion. The server deletes a report from a dashboard when you delete it from the repository or move it to a new location.
• Embedded dashboards:
• A dashboard can include other dashboards, unless this creates a circular dependency. Do not attempt to add a dashboard to itself.
• Multiple reports in a dashboard that refer to the same input control are controlled by that single input control. If you want users to set the input controls separately for each report, create two dashboards, both of which refer to the input control; then, create a third dashboard that includes the other two.
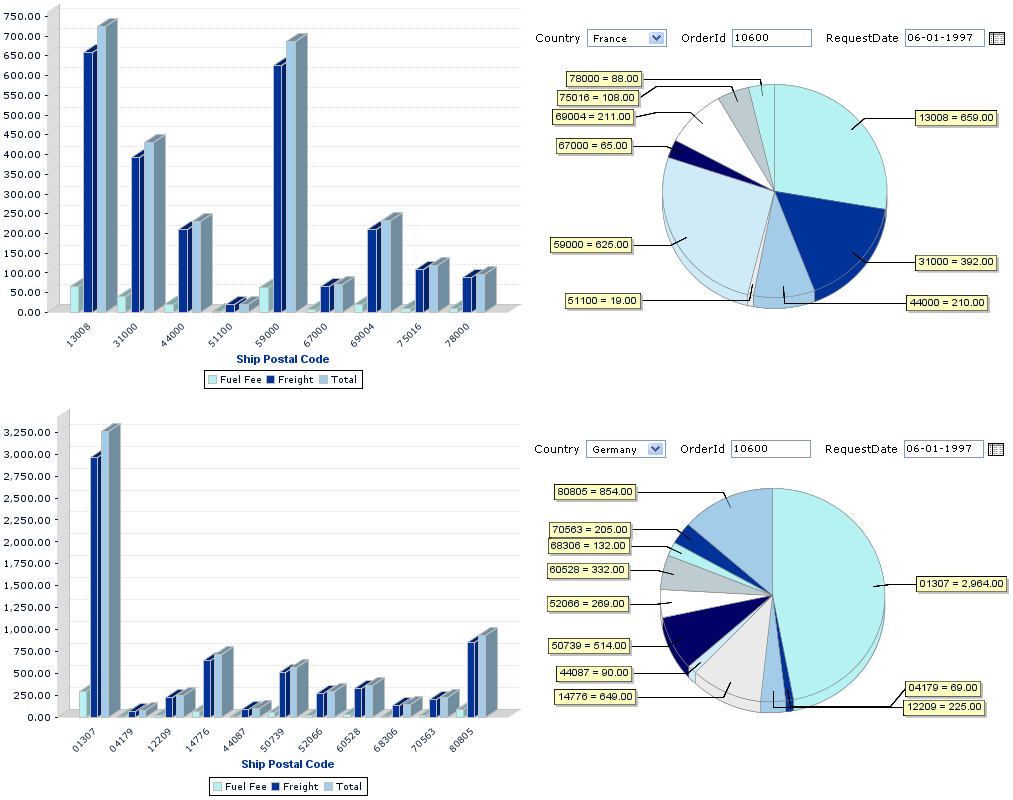
• Adding the same dashboard twice to a parent dashboard can create a compelling comparison, as shown in See "A Dashboard Comparing Data from Two Countries":
|
|
When you create a dashboard, you can set the size of the canvas to match a particular screen resolution. For example, end users’ laptops display a screen resolution of 800 by 600 pixels, so you set the size of the canvas to 800 by 600 pixels to emulate the user environment.
|
|
If you design for a screen size as large or larger than your own, try hiding the Available Content pane, or using a larger monitor to minimize horizontal scrolling. |
By default, the dashboard designer supports five standard screen resolutions, which are available by clicking Options > Guide. When a dashboard uses fixed sizing, its frames do not resize automatically when the window size changes.
In addition to fixed screen resolutions, dashboards support proportional sizing. When a dashboard uses proportional sizing, its frames resize relative to the size of the browser window. Frames do not resize automatically in the designer; proportional sizing is only evident in the end user’s view of the dashboard, or when you select a new screen size in the designer.
If a dashboard that uses proportional sizing is larger than the specified screen size, when the dashboard is viewed, Jaspersoft resizes the frames to fit in the window. No scrolling is required. This may result in a change to the shape of the frames.
|
|
Jaspersoft recommends that you design dashboards using fixed sizing mode, then switch to proportional sizing before you save. |
In proportional sizing, note that:
• You can resize free text items to a smaller size, but you can’t make them larger.
• The grid turns red when any content hangs over the edge of the canvas.