The JasperReports Server Professional and Enterprise editions support Flash charting, and include the Maps Pro, Charts Pro, and Widgets Pro component libraries. Using the libraries, you can create visually appealing, animated, and interactive reports:
• Maps Pro – Color-coded maps covering all countries and regions of the globe.
• Charts Pro – Standard and stacked charts with animation and interactivity.
• Widgets Pro – Non-standard charts such as gauges, funnels, spark lines, and Gantt charts.
These components are based on Fusion libraries and generate Flash output that is embedded in the HTML and PDF output. When a report containing a Maps, Charts, or Widgets Pro element is exported in a format other than HTML or PDF, the space used by the element remains blank.
To view a Maps, Charts, and Widgets Pro element in the server, install Flash Player. You might need to install plug‑ins or enable Flash on the browser. To view Flash elements in PDF output, use a Flash-enabled PDF viewer such as Adobe Reader.
Flash charts are created in iReport Designer Professional as JRXML reports and uploaded to the repository as a report unit. JasperReports Server cannot create Flash charts. The sample data installed with the server includes several simple examples of Flash charts.
To find and run a Flash chart example:
| 1. | From any page in the server, type flash into the search field and press Enter or click |
The search results include Flash Chart Report, Flash Map Report, Flash Widget Report, and the Open Flash Charts Report, an experimental report that uses a different Flash library from the Charts Pro, Maps Pro, and Widgets Pro components, which are fully supported by Jaspersoft.
| 2. | Click a Flash report other than the Open Flash Charts Report. For example, open the Flash Map Report: |
|
|
|
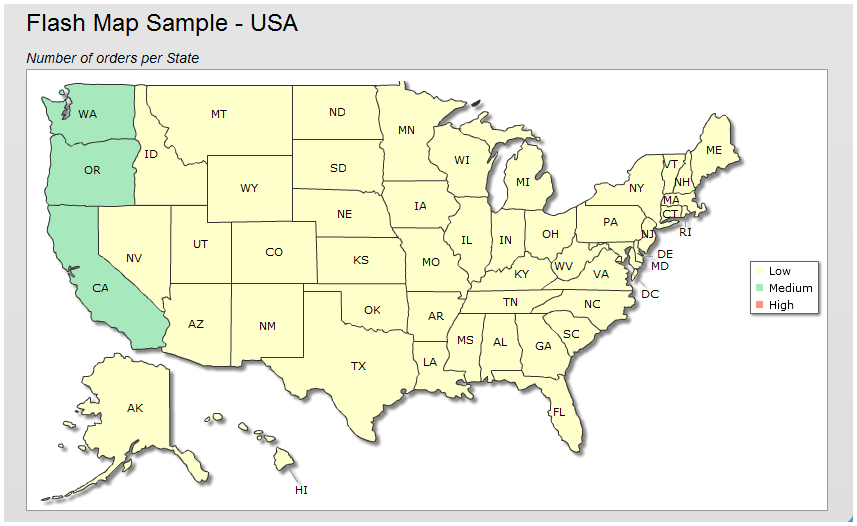
Output of the Sample Flash Map Report |
The color‑shaded states correspond to value ranges defined by the legend.
Flash reports launch in the same manner as other reports. However, Flash charts can be animated as they are drawn, giving them greater visual appeal. Flash charts are also interactive.
| 3. | To interact with the map, mouse-over any of the states on the map to see the full state name and, when data exists, the value for that state: |
|
|
|
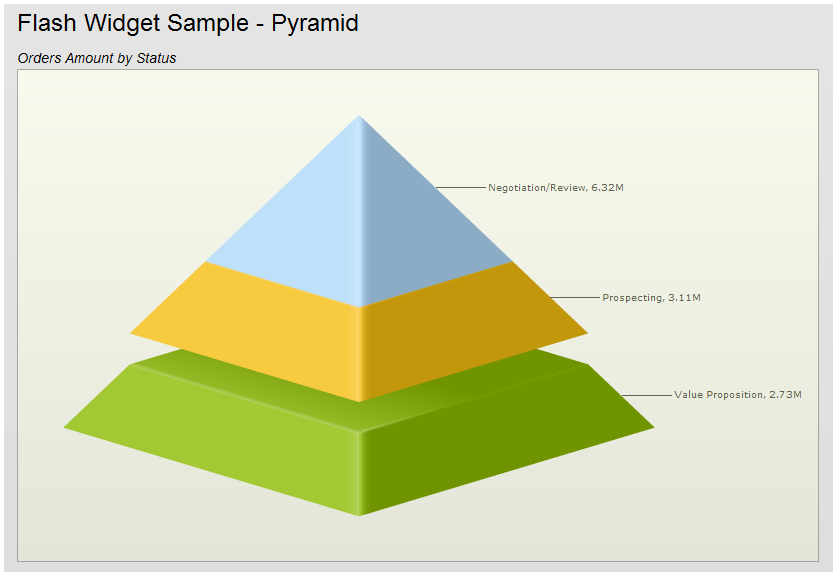
Output of the Sample Flash Widget Report |
| 4. | To edit the pyramid widget, click a segment to separate it from the others. |
These simple examples with arbitrary data show how Maps, Charts, or Widgets Pro components can present several layers of information in compelling ways.
Flash reports include the following features:
• Text, including labels in maps, charts, or widgets, that can be localized because the report is written in JRXML. For more information about uploading resource bundles for Maps, Charts, or Widgets Pro components, see the iReport Ultimate Guide.
• Chart elements, map regions, and widget segments can link to reports that provide details. Depending on the security settings in the Flash Player, you may need to enable links.
For information about creating Flash charts, see the iReport Ultimate Guide. To upload JRXML reports, see Adding Reports Directly to the Repository.