New Chart Theme in iReport
Using iReport, you can create new chart themes that give a custom look to any chart. You can easily set the fonts, colors, line widths, and other settings that determine the appearance of charts. You can then import the chart theme for use in reports generated in the server, either on a report-by-report basis or as a global setting for all charts that do not provide their own theme. After creating the chart theme, you can upload it to the server using the JasperReports Server Plug-in.
To create a new chart theme in iReport:
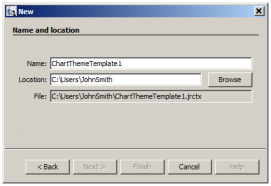
1. Select File New Chart Theme and click Finish.
The new file dialog box opens with a default file name. Chart themes use the .jrctx file extension.
|
|
|
New Chart Theme in iReport |
2. Enter a name and location and click Finish.
Alternatively, open an existing chart theme file with the .jrctx extension.
The chart theme editor appears in the Designer window.
3. Maximize and pin, if necessary, the following windows, which you use together to work with the chart theme:
• Template Inspector on the left – Select a category of properties.
• Properties on the right – View and change properties.
If the windows are not open, select Window Template Inspector and Window Properties.
These windows are shown in Chart Theme Editor in iReport.
The available options are based on the JFreeChart library used to generate charts. iReport supports only the most common options provided by JFreeCharts.
|
|
iReport supports only the most common options provided by JFreeCharts. |
4. Select each category in the template inspector and review the available options, which appear in the properties window to the right.
5. Select a property to change its value.
Depending on the nature of the property, you might type text, select a color, check or clear a check box, or select a value from a drop-down. As you update the chart theme, the Designer shows your changes. For example, change the Series Color property in the Plot category to set the color of the data series in the chart.
6. Select different chart types from the drop-down.
|
|
Testing the theme with different chart types is critical if you are creating a theme for use with many reports, such as a corporate chart theme. |
7. To view the XML that defines the chart theme’s appearance, click the XML tab.
|
|
8. When you are satisfied with the chart theme, click File Save to save the chart theme.
This saves the report to your local hard drive.
9. In the template inspector, right-click Chart Theme, and click Export as Jar from the context menu.
|
|
|
Exporting a Chart Theme |
10. Enter the name of the theme and the name of the JAR file when prompted to identify the chart theme.
The chart theme name is the text that appears in the Chart Theme drop-down in iReport’s properties list. If you don’t want this theme to be available in iReport for some reason, clear the check box.
11. Leave the box checked if you want the JAR to be placed on iReport’s classpath.
12. Click Export.
The chart theme is exported. The theme can be used at the report or server level in JasperReports Server. For more information, refer to the JasperReports Server Administrator Guide.
|
|
In iReport, you can upload the chart theme to the server using the JasperReports Server plug-in; right-click the folder in the repository where the theme should reside, and select Add JAR Archive. |