![]()
The Ad Hoc settings apply to Ad Hoc views based on Topics or Domains. Ad Hoc views based on OLAP connections use the OLAP settings described in the Jaspersoft OLAP User Guide.
Ad Hoc settings help you fine-tune the Ad Hoc Editor and the views it creates. You must be logged in as a user with ROLE_SUPERUSER to manage the Ad Hoc settings and cache. This section includes:
• Ad Hoc Editor Configuration File Options
• Configuring Ad Hoc OLAP Filters
|
|
The Ad Hoc settings apply to Ad Hoc views based on Topics or Domains. Ad Hoc views based on OLAP connections use the OLAP settings described in the Jaspersoft OLAP User Guide. |
The Ad Hoc settings limit the resources available for queries when Ad Hoc views are designed and run. The options are:
• Ad Hoc Filter List of Values Row Limit. The maximum number of items that should be displayed in the Condition Editor when a user defines filters for an Ad Hoc view that is based on a Domain. If this limit is exceeded when users define filters, JasperReports Server displays a message to that effect. Setting this to a lower value can improve performance.
• Ad Hoc Dataset Row Limit. The maximum number of rows that an Ad Hoc view can return. JasperReports Server truncates the data when the limit is reached. Setting this to a lower number may improve performance, but your reports may not reflect the full data set.
• Ad Hoc Query Timeout. The number of seconds the server should wait before timing out an Ad Hoc view while running its query. Setting this to a lower number may prevent exceptions from being displayed to users when they run Ad Hoc views. Setting this to a higher number may prevent complex calculations from timing out, but it results in the use of more database connections.
|
|
Ad Hoc settings are reset every time the server restarts. If you make changes, you must redo them after every restart. |
To set Ad Hoc settings in JasperReports Server:
1. Log in as system administrator (superuser by default).
2. Select Manage > Ad Hoc Settings.
3. In the Ad Hoc Filter List of Values Row Limit field, enter the maximum number of items to display in the Condition Editor when a user defines filters for an Ad Hoc report based on a Domain.
4. In the Ad Hoc Dataset Row Limit field, enter the maximum number of rows that an Ad Hoc view can return.
5. In the Ad Hoc Query Timeout (seconds) field, enter the number of seconds the server should wait before timing out an Ad Hoc report while running its query.
6. Click Save to make your changes effective. Or click Reset to return to the previously saved values.
|
|
Data snapshots, described in sections Data Snapshots and Enabling Data Snapshots, apply only to reports displayed in the report viewer. This section covers data policies that only apply to views in the Ad Hoc Editor. |
Data policies determine how JasperReports Server handles data loading and processing for certain kinds of Ad Hoc views. They determine how data is cached and where certain calculations occur. For example, you can specify that the data accessed by Domain-based reports is grouped, sorted, and aggregated in the database rather than having the server process it in memory.
By default, the server relies on the database to group, sort, and aggregate data returned by queries based on Domains when it is feasible. It also forces the server to only retrieve the fields that appear in the report (rather than the entire set of fields in the Domain). For queries based on JDBC data sources, such processing occurs in memory, and the entire result set defined in the Topic is returned.
If a query contains only aggregate values, JasperReports Server can generally transform it into an aggregate database query, but some functions (such as distinct count and average) must be calculated by reading all the detail rows from the database and performing the aggregation in memory. Note that independent check boxes control the behavior: one for Domains and another for JDBC data sources.
When these settings are disabled, the server loads the entire set of fields associated with a Domain or Topic into memory, and then applies the necessary grouping, sorting, and aggregation. This is also the case for Ad Hoc views that do not rely on Domains or JDBC data sources; in these cases, the server processes the data in memory.
Generally, Jaspersoft recommends that these settings be enabled, especially when working with large datasets. In deciding whether JasperReports Server should process the data in memory or push that processing to the database, consider these factors:
• The size and complexity of your reports. Reports with complex sorting, grouping, or aggregation may perform better when the server optimizes the queries.
• The amount of data in your data sources. If your data sources include a great deal of data, reports against them may perform better when the server optimizes the queries.
• The number of users editing and running Ad Hoc views. If you have a large number of users creating and running Ad Hoc views, performance may be better when the server optimizes the queries. Implementations with fewer users may perform better when the options are disabled.
• The performance characteristics of your data source. If the database or other source of data is tuned for maximum performance, Ad Hoc views may perform better when the server optimizes the queries. Note that, if your data source is hosted by MySQL, Jaspersoft recommends that you clear the check from the Optimize Queries for Domain-based Reports box.
• The amount of memory allocated to JasperReports Server's Java Virtual Machine (JVM). If the JVM of the application server hosting JasperReports Server is allocated plenty of memory, Ad Hoc views may perform better when JasperReports Server optimizes the queries. This is especially true if your data source tends to be slow.
To decide whether JasperReports Server should optimize queries for Ad Hoc views, Jaspersoft recommends disabling the settings, opening and saving some representative reports, and testing their performance. If the performance improves, leave the settings disabled and open and save the remaining reports.
|
|
Data policies are reset every time the server restarts. If you make changes, you must redo them after every restart. |
The data polices that you can set are:
• Optimize Queries for JDBC-based Reports. Selects grouping, sorting, and aggregation of queries for JDBC-based reports. Otherwise, the queries run unaltered in memory.
• Optimize Queries for Domain-based Reports. Selects grouping, sorting, and aggregation of queries for Domain-based reports. Otherwise, the queries run unaltered in memory.
To set data policies in JasperReports Server:
1. Log in as system administrator (superuser by default).
2. Select Manage > Ad Hoc Settings.
3. Select Optimize Queries for JDBC-based Reports to process queries for JDBC-based reports.
4. Select Optimize Queries for Domain-based Reports to process queries for Domain-based reports.
5. Click Save to make your changes effective. Or click Reset to return to the previously saved values.
|
|
These data policy settings do not retroactively update the existing reports created from Ad Hoc views in your repository. To change the data policy for an existing report, select the appropriate policy setting, open the corresponding view in the Ad Hoc Editor, and save the report again. |
When handling large datasets (big data) from a Domain source in the Ad Hoc Editor, fields summarized by distinct count are computationally intensive. You can speed up the display of your data by requesting distinct count calculations from the data source, as opposed to performing the calculations in memory. Database servers are usually optimized for these calculations, which improves the overall performance of the Ad Hoc Editor.
|
Ad Hoc for Big Data |
||
|
Configuration File |
||
|
…\WEB-INF\applicationContext-adhoc.xml |
||
|
Property |
Bean |
Description |
|
calcMethod |
DistinctCount |
Change this property from value="sqlGroupBy" (the default) to value="sqlUnionAll". The UnionAll is the modified query that provides distinct count computed by the database. |
After making this change, redeploy the JasperReports Server webapp or restart the application server.
Performing distinct count aggregates in the database applies only in the following cases:
• Crosstabs based on Domains contain measures aggregated by distinct count.
• Tables based on Domains contain groups aggregated by distinct count, but no detail rows.
This setting has no effect when:
• There is a calculated field, for example a Groovy-based field, anywhere in the report.
• There is a row or column group involving a time, timestamp, or date.
In these cases, Ad Hoc performs the distinct count summary calculations in memory, regardless of the calcMethod setting.
The following properties are among those that can be configured in the WEB-INF/applicationContext-adhoc.xml file:
|
Property |
Description |
|
JrxmlScriptURI |
The location in the file system of the state2jrxml.js script, which generates the JRXML report based on the current Ad Hoc Editor selections. By default, this file is located in the /adhoc folder of the repository. |
|
realmsURI |
The repository location where Topics should reside. The default is /adhoc/topics. |
|
defaultTheme |
The name of the default style for Ad Hoc views. This name must match a style defined in both a CSS and a JRXML file. The default is default. |
|
aruFolder |
The repository location where users are allowed to save their Ad Hoc views. The default is /. This allows your users to save Ad Hoc views anywhere. If you have a folder specifically for user content, specify this folder; for example, /userviews. |
|
tempFolderName |
The repository location where JasperReports Server saves reports created from Ad Hoc views. The default is /temp relative to root and to every organization. The server allows users with ROLE_ADMINISTRATOR or ROLE_SUPERUSER to view the temporary folders and their contents. The server manages these temporary files automatically, but files may accumulate in certain cases. As part of regular maintenance, you should periodically delete the files in these folders. |
|
maxSafeGroupMembers |
The maximum number of row groups or column groups a crosstab can display before the editor prompts the user for confirmation. This limit is a safeguard to avoid performance issues when grouping a field with too many values. The default is 100. Set it higher to allow more groups to appear without prompting users. |
|
|
The Ad Hoc cache applies to Ad Hoc reports based on Topics or Domains. Ad Hoc reports based on OLAP connections use the OLAP cache. For a comparison of the two caches, see section Comparison with Jaspersoft OLAP. For instructions on setting the OLAP cache, see the Jaspersoft OLAP User Guide. |
JasperReports Server can temporarily cache ad hoc query result sets for re-use. The cache is populated by the data that results from queries when creating or running Ad Hoc views. The datasets are uniquely identified by a key that references the query itself, the data source URI, and parameters used when the query was issued.
Caching reduces hardware loads and delivers frequently-used datasets to the user quickly. Caching applies when reports are created as well as when they are run. You can configure the Ad Hoc cache to optimize response time for your usage patterns.
By default, datasets for each user are cached separately; a parameter in the cache key identifies the user. This per-user caching can result in duplicate datasets when different users run the same query, impairing performance. You can configure JasperReports Server to share cached datasets across users by adding the following lines to \WEB-INF\applicationContext-datarator.xml. The following code configures the cacheKeyInterceptor bean to ignore logged-in users’ credentials when creating the cache keys:
|
<property name=”ignoredParameters”> <list> ... <value>LoggedInUser</value> <value>LoggedInUsername</value> </list> </property> |
Restart JasperReports Server after adding the code.
Caching improves overall performance of data retrieval and sorting, but unused datasets can consume memory and cached data can become stale. To address these concerns, JasperReports Server automatically removes datasets periodically. By default, datasets are removed from the cache if they are not accessed for 20 minutes. They are also cleared after 60 minutes, regardless of how recently they were accessed.
To configure the frequency with which the cache is automatically cleared, edit the following configuration file:
|
Ad Hoc Cache Expiration |
||
|
Configuration File |
||
|
…\WEB-INF\applicationContext-datarator.xml |
||
|
Property |
Bean |
Description |
|
defaultTimeoutMinutes |
dataSetCache |
The number of minutes to wait before removing a dataset from the cache. Ensures that stale data is periodically replaced. The default is 60 minutes. |
|
defaultUnusedTimeoutMinutes |
dataSetCache |
The number of minutes to wait after a dataset is used before removing it. The default is 20 minutes. |
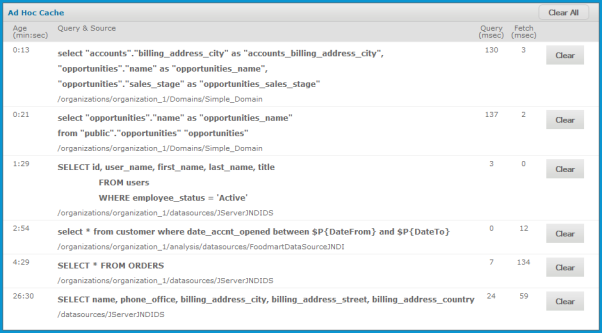
Administrators can also use the server interface to view the queries whose datasets are in the cache. Administrators can see the full query but never the contents of the dataset. The Ad Hoc cache page also displays performance data about each query. This information can be helpful when trying to resolve performance issues. The interface displays two values for every query:
• Query (msec) – Time in milliseconds from when query was sent to the data source (database) until the first row was received.
• Fetch (msec) – Time in milliseconds from when first row was received from the data source (database) until the last row was received
The Ad Hoc cache page also allows administrators to manually remove datasets if necessary. Removing a dataset from the cache forces the server to get fresh data the next time a user creates or runs an Ad Hoc view with that query.
To view queries and manually clear the Ad Hoc cache:
1. In JasperReports Server, log in as system administrator (superuser by default).
2. Click Manage Ad Hoc Cache.
The Ad Hoc Cache page appears, displaying all the datasets that are in the cache, sorted by age.
|
|
As shown in See "Ad Hoc Dataset Caching Administration Page", each dataset is listed by its corresponding query and data source. Recall that Ad Hoc Topics have user-defined queries, so they tend to be short, whereas the query for Domains are generated from the design of the Domain and user selections in the Data Chooser dialog. The Ad Hoc Cache page only displays the first few lines of a query, as well as the data source.
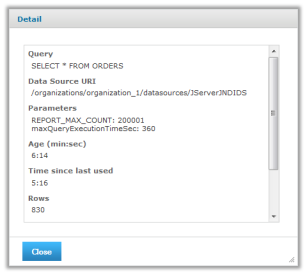
3. To view the details of a specific query, including the full query string, click it in the Query & Source column.
The Detail page appears, displaying additional information for the selected query, such as the number of rows in the cached dataset.
|
|
|
Typical Dataset in Ad Hoc Cache |
4. To remove a dataset from the cache, close the Detail dialog if necessary, and click Clear beside the corresponding query.
5. To remove all datasets, click Clear All at the top of the Ad Hoc Cache page.
The following table contrasts the key features of the Ad Hoc cache in JasperReports Server and Jaspersoft OLAP.
|
Cache Feature |
JasperReports Server |
Jaspersoft OLAP |
|
Structure of cache |
Result caches are held at the query level: query text and language, plus data source URI and query parameters. |
Result caches are held at the analysis connection level: schema plus database connection. |
|
Sharing |
Not by default, but can be enabled as described in section See "Setting the Cache Granularity" above. |
There is only one cache; it is shared across all queries and users. |
|
Security |
Applied to cache control so that users are not allowed to see privileged data. |
|
|
Populating |
Queries populate the cache. You can also schedule reports to pre-populate the cache during off-hours. |
|
|
Size |
Limited by available JVM memory (heap). Not configurable. Running out of memory is unusual. It can only happen if a single query returns too many elements for available memory. The report fails with an out-of-memory error. |
|
|
Automatic time-based cache policy |
Configurable, as described in section See "Configuring the Cache" above. |
In low-memory situations, cached items are removed automatically by JVM garbage collection; the least-recently-used items are cleared first. There is no way to remove data based on how long it has been in memory. |
|
Clearing selected datasets manually |
Configurable, as described in section See "Manually Clearing the Cache" above. |
Cache regions can be defined and cleared programmatically with APIs. |
|
Clearing all datasets manually |
Configurable, as described in section See "Manually Clearing the Cache" above. |
In JasperReports Server, select Manage > OLAP Settings, then click Flush OLAP Cache. For additional methods, see the Jaspersoft OLAP Ultimate Guide. |
|
|
Disabling either cache is a server-wide setting that applies to all data sources or connections used in any Ad Hoc view. Make sure that other views aren’t negatively affected by this change. |
There are two reasons to consider disabling the Ad Hoc cache:
• You have a high-performance database that returns results so fast that additional caching in the server does not improve response times. In this case, the slight overhead of the cache may actually impact performance.
• Your database manages real-time data, and you create Ad Hoc views that present up-to-the-minute information from this data source. In this case, you do not want to retrieve old data out of the cache.
To disable the Ad Hoc cache for Topics and Domains, set the defaultTimeoutMinutes and defaultUnusedTimeout-Minutes parameters shown in section Configuring the Cache both to 0 (zero).
To disable the OLAP cache for OLAP connections used in the Ad Hoc Editor, check the mondrian.rolap.star.disable-Caching setting on the Manage OLAP settings page. For more information, see the Jaspersoft OLAP User Guide.
In addition, if you have modified any of these three properties in applicationContext-adhoc.xml, set them back to false:
<property name="applyQueryFilterInMemory" value="false"/>
<property name="applySecurityFilterInMemory" value="false"/>
<property name="applyDynamicFilterInMemory" value="false"/>
When using filters in Ad Hoc OLAP, the server queries the database to display a list of values to select from. To avoid performance issues, there is a limit on the number of items in a filter. By default, the limit is 250 possible values.
If your filters reach this limit and your list of values is truncated, you should first consider using a different filter operation. For example, instead of “city is one of <list>,” use “City starts with <letter>.” If you still need to change this limit, modify the following property:
|
Ad Hoc OLAP Filter Limit |
||
|
Configuration File |
||
|
…\WEB-INF\applicationContext-adhoc.xml |
||
|
Property |
Bean |
Description |
|
Set the value to the maximum number of filter values you expect. Setting this value higher than the default of 250 may cause performance issues. |
||