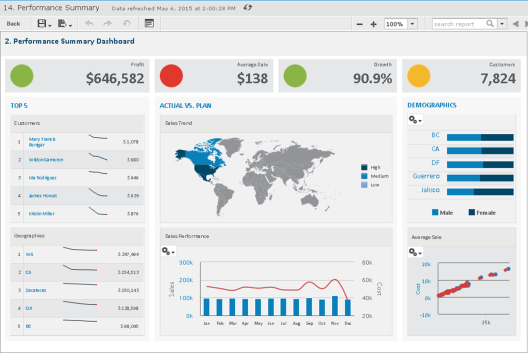
Performance Summary Dashboard with Flash Map
The JasperReports Server commercial editions support Fusion charting, and include the Maps Pro, Charts Pro, and Widgets Pro component libraries.
Using the libraries, you can create visually appealing, animated, and interactive reports:
| • | Maps Pro – Color-coded maps covering all countries and regions of the globe. |
| • | Charts Pro – Standard and stacked charts with animation and interactivity. |
| • | Widgets Pro – Non-standard charts such as gauges, funnels, spark lines, and Gantt charts. |
These components are based on Fusion libraries and generate HTML5 output that is embedded in the HTML and PDF output. When a report containing a Maps, Charts, or Widgets Pro element is exported in a format other than HTML or PDF, the space used by the element remains blank.
Flash is no longer recommended.
For configuration information, see the JasperReports Server Administrator Guide for more information.
Fusion charts are created in Jaspersoft Studio Professional as JRXML reports and uploaded to the repository as a report unit.
To find and run a chart example:
| 1. | In the repository, locate the sample report 14. Performance Summary. |
| 2. | Click the report name to run the report, which launches as part of the Performance Summary Dashboard. |
|
|
|
Performance Summary Dashboard with Flash Map |
Note the Sales Trend map in the center of the dashboard.
| 3. | To interact with the map, mouse-over any of the countries to see the full country name and, when it has data, the value for that country. |
| 4. | On the Sales Trend map, click Canada to launch the Interactive Sales Report, displaying the information for Canada only. From there, you can modify the underlying report as needed. |
To upload JRXML reports, see Adding Reports Directly to the Repository.