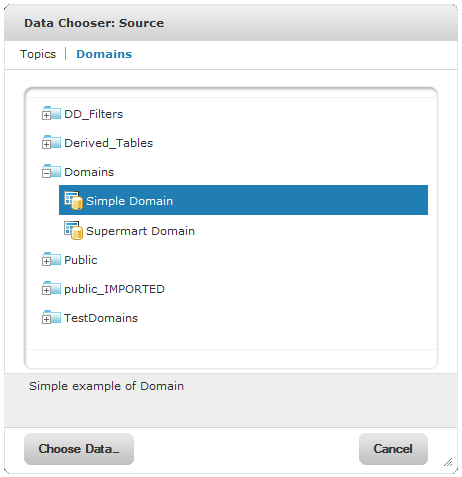
Data Chooser with the Simple Domain Selected
Like Topics, administrators and data analysts create Domains for reuse to simplify access to data during report design. Domains give report makers more flexibility than Topics in choosing fields from the database and allow filtering of the data before it is included in a report.
A report based on a Domain can prompt the reader for input that determines what data is presented. For example, if a Domain includes all sales data for a company, the report can present detailed information grouped by postal code and prompt the reader to select the geographic area, such as a US state. The report displays only the pertinent information.
For a more complete description of how to create Domains, see section 6.2, “Example of Creating a Domain,” on page 138.
When you create an Ad Hoc report based on a Domain, the Data Chooser wizard leads you through the steps of choosing fields and filters. The following example shows how to use the Data Chooser to create a simple report from a Domain.
For complete information about the options and settings available for designing reports, see Using the Data Chooser Wizard.
To create a basic report from a Domain:
| 1. | On the Home page, click Create > Ad Hoc Report. |
The Ad Hoc Editor opens the Data Chooser wizard.
| 2. | Click Domains. |
The list of the available Domains appears.
|
|
|
Data Chooser with the Simple Domain Selected |
|
|
At the bottom of the Domains tab is a description of the selected Domain. |
| 3. | Select Simple Domain. |
| 4. | Click Choose Data. |
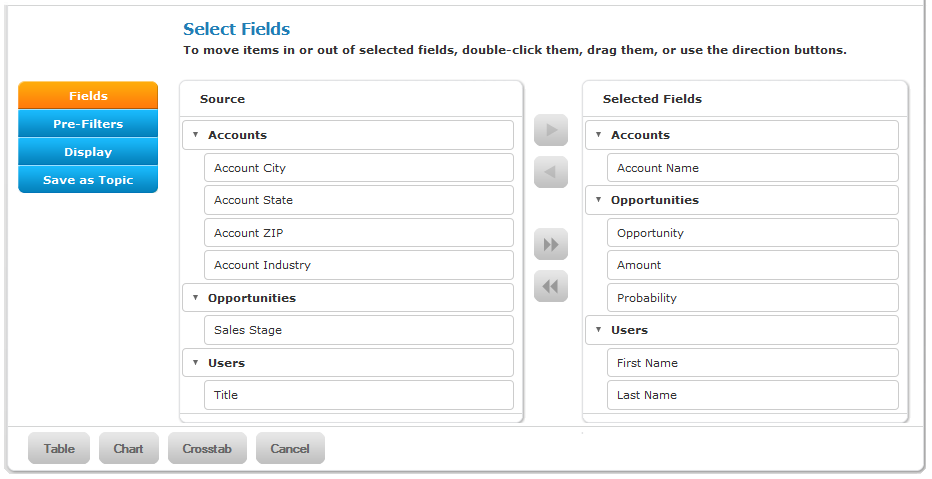
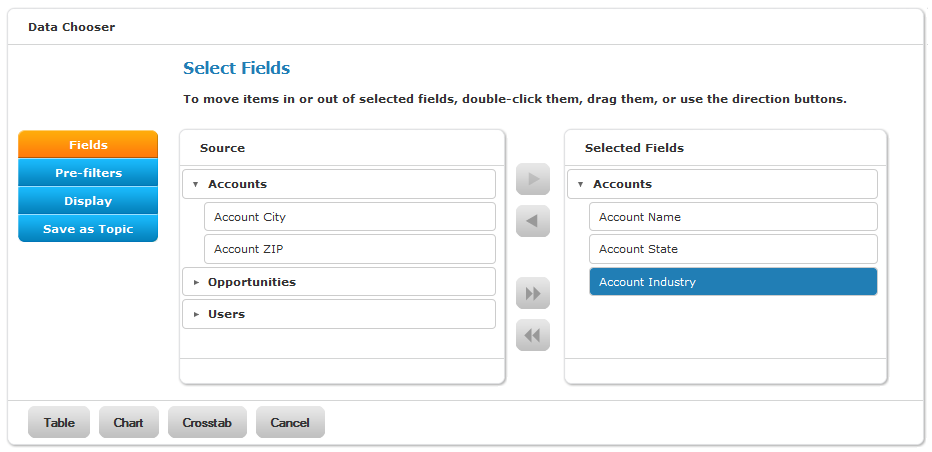
The Data Chooser opens to the Select Fields page:
|
|
|
Data Chooser: Select Fields Page |
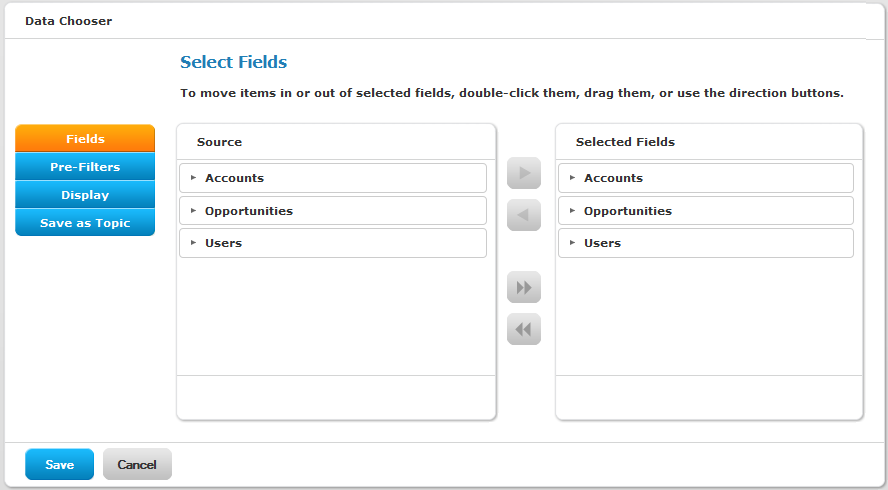
The sets belonging to the Domain appear in Source. You can select whole sets or individual items within a set. A set appears in the Ad Hoc Editor as a set of fields that can be added together to a table.
| 5. | In this example, expand each set and drag the following fields from Source to Selected Fields: |
• Accounts set: Account Name field.
• Opportunities set: Drag the whole set, but then drag back the Sales Stage field.
• Users set: First Name and Last Name fields.
If you move a field from Source to Selected Fields, the field name and the name of its set appear in Fields.
|
|
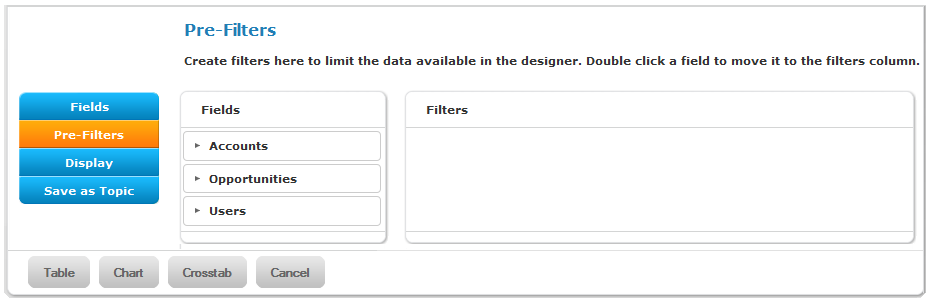
| 6. | Choose Pre-filters. |
The Data Chooser shows the Pre-filters page; you can set limits on the data that are retrieved and displayed in the table:
|
|
| 7. | Expand the sets in Fields. For this example, double-click Amount in the Opportunities set. |
The item appears in Filters. If a Domain is configured for secure access, only the fields that you have permission to access are displayed. Other fields might not be visible to you, even though someone else might see them using the same Domain. Conversely, the fields that you can see might include ones that another user can’t see.
| 8. | In the Filters condition drop-down, select the operator for the comparison: is Greater than or Equal to. |
| 9. | Enter the value to compare the data against: 10000. |
| 10. | Click OK. |
The complete filter condition appears in Filters. In this example, the filter selects only the rows of data where the opportunity amount has a value of 10,000 or more.
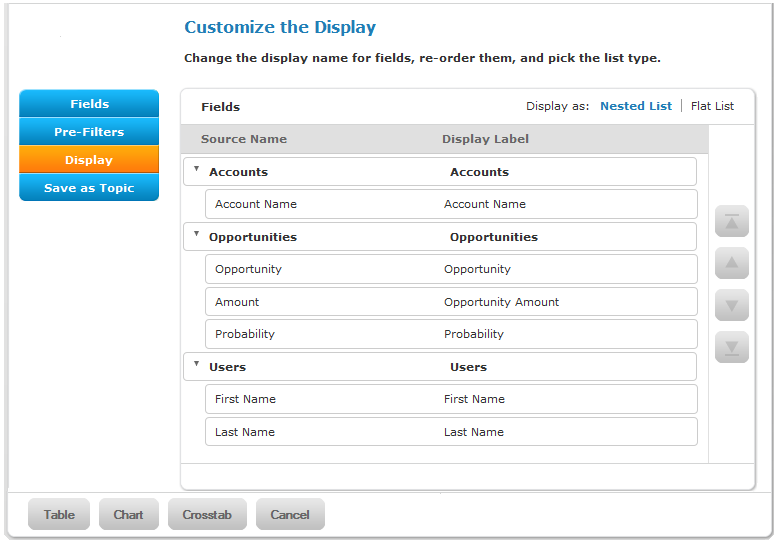
| 11. | Choose Display. The Data Chooser shows the Customize the Display page. |
| 12. | Select the Amount item and change its display label to Opportunity Amount: |
|
|
Note that the display names are shown under Display Label.
|
|
On the Customize the Display page, you can edit the table and display labels in the Ad Hoc Editor to clarify them for the report’s audience. The source names are often appropriate display labels, but if not, the Display page gives you a final opportunity to change them. |
If you want to create different reports with the same settings, you can save the settings as a Domain Topic, as described in section Creating Topics from Domains.
| 13. | To confirm all the selections made in the Data Chooser and begin creating a report, choose Save as Topic. |
| 14. | Click Browse. |
The Choose the destination folder dialog box appears.
| 15. | Choose the destination folder, then choose Select. |
| 16. | Click the Table button to save the Domain Topic and begin designing a tabular report in the Ad Hoc Editor. |
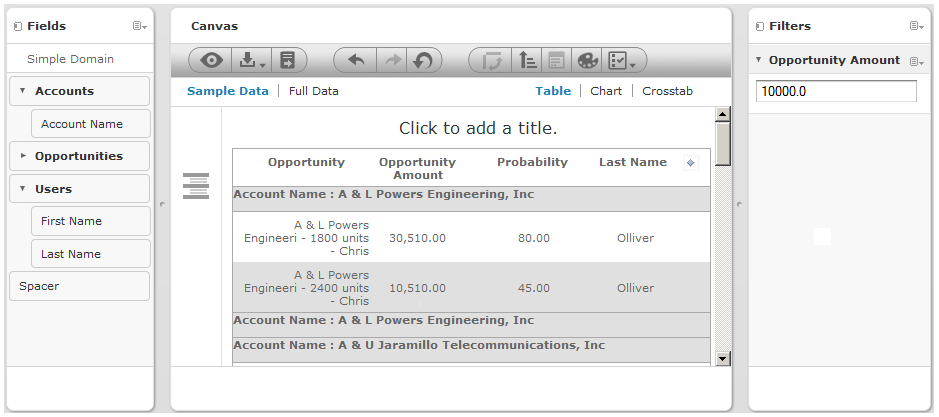
The Ad Hoc Editor appears, and Fields shows the items selected in See "In this example, expand each set and drag the following fields from Source to Selected Fields:".
| 17. | Design the report in the Ad Hoc Editor, as described in sections Selecting the Content of a Report and Formatting the Appearance of a Table. |
In this example:
Drag the Opportunities set to the canvas to add all its fields as columns.
They are added (with the display name) in the order you defined on the Display page in See "In this example, expand each set and drag the following fields from Source to Selected Fields:".
| a. | Drag Spacer from Fields to an empty spot on the canvas. The Spacer appears after the last column in the table. |
| b. | Expand the Users set and double-click the Last Name field. |
| c. | Expand the Accounts set and drag the Account Name item to the Group Control icon |
Notice that all amounts are greater than 10000, as determined by the filter you defined.
|
|
|
Ad Hoc Editor with Fields Configured for Report |
As shown in this example, creating an Ad Hoc report based on a Domain gives you more flexibility in selecting data and can subsequently speed up the design of the report itself.
In top right corner of Fields, you can click ![]() , then chooseSelect Fields to change the fields used in the report.
, then chooseSelect Fields to change the fields used in the report.
The Select Fields window appears, displaying two lists of tables:
• Selected Fields lists fields that you selected while creating the report.
• Available Fields lists the other tables in the Domain that you can use in this report. Note that you can select only the tables chosen when you created the topic.
You can expand a set in Available Fields to see its fields; fields that are used on the canvas as filters, or for sorting, appear gray in Selected Fields to indicate that they can’t be removed from the report.
You can drag a table from Available Fields to Selected Fields to add it to the report, or you can drag a table from Selected Fields to Available Fields to remove it from the report.When you remove a table, all the its fields are removed except those that are in use. You can also drag individual fields to add or remove them. If you add or remove a field accidentally, click ![]() to undo the change.
to undo the change.
To design a Domain Topic or an Ad Hoc report based on a domain, use the Data Chooser wizard. To open the Data Chooser wizard, click Create > Ad Hoc Report. Select Domains, click a Domain, and click Choose Data to access the following pages of the Data Chooser wizard:
• The Select Fields Page – Choose the fields to make available in the Ad Hoc Editor.
• The Pre-filters Page – Define a filter on any field, with the option of prompting for user input, or to compare fields.
• The Display Page – Change the order and names of fields that appear in the Ad Hoc Editor.
• The Save as Topic Page – Save the settings as a Domain Topic.
You must first select some fields on the Select Fields page, but the other three pages are optional and can be completed in any order. Click Table, Chart, or Crosstab at any time to begin designing a report based on the chosen data.
Use this page to choose fields and sets of fields to use in the report or make available in the Domain Topic.
|
|
• The Source panel displays the sets of fields in the Domain. Use ![]() and
and ![]() close or expand each set.
close or expand each set.
• The Selected Fields panel shows the items you selected. You can move a field or set back and forth between the panels by dragging, double-clicking, or selecting the item and clicking an arrow button, such as ![]() .
.
• If you move an individual field out of a set, it appears in a set of the same name, for example Accounts, as shown in See "The Select Fields Page of the Data Chooser Wizard". If you do not want sets, use the settings on the Display page.
• Some Domains define sets that are not joined. When you select a field from such a set, the unjoined sets aren’t available.
Filters are similar to input controls. You can pre-filter data in the Data Chooser wizard before clicking Table, Chart, or Crosstab to launch the Ad Hoc Editor or before clicking Save as Topic to create a Domain Topic. Pre-filtering data limits the data choices available in a Domain Topic or the fields that ultimately appear in the Ad Hoc report. You also can define a filter on a field that does not appear in the report. The filter is still applied and only data that satisfies all defined filters appear in the final report. For example, you can filter data to select a single country, in which case it doesn’t make sense for the Country field to appear as a row, column, or group. You also can design reports that prompt users for input of data to use as a filter.
The Pre-filters page provides powerful functionality for designing reports within the server.
To define a filter:
| 1. | In the Data Chooser wizard, click Pre-filters. |
| 2. | Double-click a field in the Fields panel. For example, click the Account Name field. |
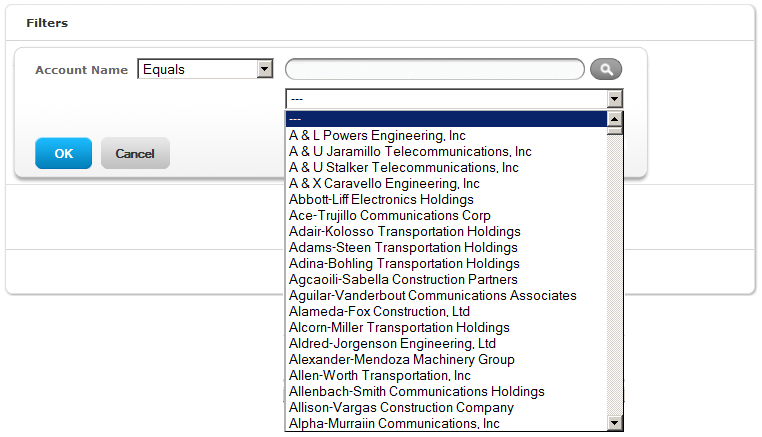
Choices appear for filtering the selected field:
|
|
|
Filters Panel on the Pre-filters Tab |
|
|
The particular comparison operator and value operand that appear depend on the datatype of the field and the actual data that exist for the field. |
The Equals comparison operator is selected by default in the comparison operator drop-down. Another drop-down contains account names.
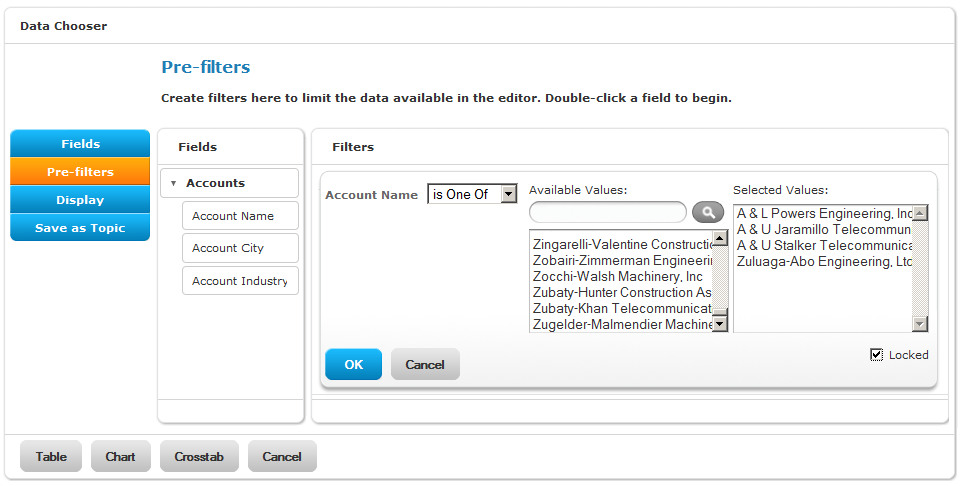
| 3. | Choose a different comparison operator. For example, change the default comparison operator, which is Equals, to is One of. |
|
|
Text fields have both substring comparison operators such as “starts with” or “contains” and whole string matching such as “equals” or “is one of.” When you select a whole string matching operator, a list appears showing all existing values for the chosen field retrieved in real-time from the database. |
In the Filters panel, a drop-down containing the account names appears from which you can select multiple values.
| 4. | Click each value for comparison in Available Values to move it to Selected Values. |
|
|
If there are more than 50 values to display in Available Values click |
The account names appear in Selected Values.
| 5. | To limit the report design to the four account names in Selected Values, check the Locked check box: |
|
|
|
Condition Editor in the Filters Panel on the Pre-filters Page |
By default, the Locked check box is unchecked, making the filter is available to end users when they run the report. On the report page, users can click the Options button to enter a comparison value for this condition; when the user clicks Apply or OK, the report preview refreshes with data that match the condition. The condition is available as a prompt even if the filtered field does not appear in the report. For example, the final report might present data for a single country, but the country is chosen by the user. Once defined, filter prompts can be modified in the Ad Hoc Editor, as explained in Using Input Controls.
Note that when the Locked check box is checked, the filter is unavailable to end users when they run the report. The condition is available in the Ad Hoc Editor, but users can only remove it; they can’t edit it.
| 6. | Click OK to define the filter. |
Filters shows the filters you have defined.
| 7. | In Filters, click Change to modify the condition. Click OK to save the changes. After selecting a row, you can also click Remove to delete it from the list. |
|
|
Data rows must match all conditions. In other words, the overall filter applied to the data is the logical AND of all conditions you have defined. |
Use the Display page to change the default label and order of the fields as they should appear in the list of fields in the Ad Hoc Editor. You can always change the field labels and ordering in the Ad Hoc Editor, but setting them here makes them available for reuse in a Domain Topic. See Customize the Display Page.
• To change the order of fields, click once anywhere in a field’s row and use the Move to top, Move up, Move down, or Move to bottom buttons:
![]() ,
, ![]() ,
, ![]() ,
, ![]()
Fields may be moved only within their set, but sets as a whole may be also be moved.
• By default, the field name becomes the display label for the row, column, or measure that you create from the given field. To change the default display label of a field or set, double-click anywhere in the row and type the new label in the text box.
• Sets and the fields they contain appear in the list of fields in the Ad Hoc Editor. Sets are not used in reports, but can be used to add all their fields at once, expediting report creation.
• If you don’t want to use sets in the Ad Hoc Editor, select display as a Flat list at the top of the Fields panel. You can now relabel the fields and reorder them.
On the Save as Topic page, you can enter a name and a description to save the Data Chooser settings as a Domain Topic. Thereafter, you can create different reports from the Domain Topic, using its fields, filters, and display label settings. You can also edit the Domain Topic to change the settings.
• After you enter a name for the Domain Topic, save it by clicking Table, Chart, or Crosstab from any page in the wizard. The Ad Hoc Editor opens in table, chart, or crosstab mode, respectively, ready to use the fields, filters, and display label settings.
• By default, Domain Topics are saved in the standard Topics folder. This corresponds to the Ad Hoc Components > Topics location in the repository; JRXML Topics and Domain Topics in this folder appear on the Topics tab when you start a report. Do not modify this folder name.
• The description text appears with the Domain Topic in the repository and at the bottom of the Topics tab of the Data Chooser wizard. Enter an informative description that helps users identify this Domain Topic.
In some circumstances, it is important to create a Topic based on the Domain and data settings you chose. In other circumstances, creating a Topic isn’t necessary. The main consideration is how reports based on the Domain are used. The following table explains the choices:
|
If you want to … |
Then do this |
Explanation |
|
Create a single-use report from the Domain with your settings. |
Click Table, Chart, or Crosstab after defining your settings in the Data Chooser wizard, then format and run your report. |
Your field selections appear in the Ad Hoc Editor and you can create reports from them, but the settings themselves are not saved. |
|
Run a report repeatedly as is or with prompting for new input, or make very similar reports in the Ad Hoc Editor. |
Click Table, Chart, or Crosstab after defining your settings in the Data Chooser wizard, then format and save the report in the Ad Hoc Editor. |
After you save a report, users can run it repeatedly and be prompted for input each time if you defined unlocked filters. Users with required permissions may also open the report in the Ad Hoc Editor. See section Formatting the Appearance of a Table. |
|
Reuse your field, filter, and display settings on this Domain to create new reports with different formatting. |
After saving your settings as a Domain Topic on the Save as Topic page of the Data Chooser wizard, start a new report and choose your Domain Topic from the Domains tab. |
See section Saving Domain Settings as a Domain Topic. Domain Topics are saved in JRXML format in the repository. They appear on the Topics tab when you start a report. |
|
Be able to modify one or more of the settings you made in the Data Chooser wizard. |
After saving your settings as a Domain Topic on the Save as Topic page of the Data Chooser wizard, find your Domain Topic in the repository and open it in the Domain Designer. |
Domain Topics can be edited as described in section Editing a Domain Topic . After you save your changes, you can create reports based on the modified Domain Topic. |
|
Run reports from the same repository data source but with different Domain settings, such as derived fields and different joins to make new fields available in a report. |
Edit the Domain and save it with a new name. Then start a new report and choose your data from the new Domain. |
Domains provide advanced functionality such as table joins and derived fields based directly on a data source. Domains usually require administrator permissions to create and modify. For more information, see section 6.5, “Editing a Domain,” on page 157. |
If other users run reports from your Domain Topic and the Domain is configured for security, it is important to consider everyone’s access permissions. You might not have access to all of the fields in the Domain nor to all the data in those fields. There may be fields that can be seen only by other users, and in the fields that you can see, there may be data that is hidden from you. When you save the Domain as a Topic, only the fields that you selected appear in the Domain Topic. When you run a report from the Topic, only the data that you can access in those fields appears. When others run reports from the Topic, they see only fields that they have permission to access.
For example, in a Domain, user Tomas can access fields B-C and data rows 1-3; Anita can access fields C-E and data rows 2‑5. Tomas uses the Data Chooser wizard and saves a Domain Topic based on the Domain. When Tomas and Anita run reports, they see different combinations of fields and the data in them.
|
|
Fields |
Data |
|
Tomas’s report from his Domain Topic |
B C |
1 2 3 |
|
Anita’s reports from the same Domain Topic |
C |
2 3 4 5 |
Even though Anita has permission to see more fields, they are not available to her because Tomas did not have access to them when he created the Domain Topic. However, Anita does have permission to see more data than Tomas, so when she opens or runs the report, she can see more rows than Tomas can when he views the report. See section The Domain Security File for a technical explanation of data security for Domains. See the note in section 6.5, “Editing a Domain,” on page 157 about the impact of editing a Domain or Domain Topic.
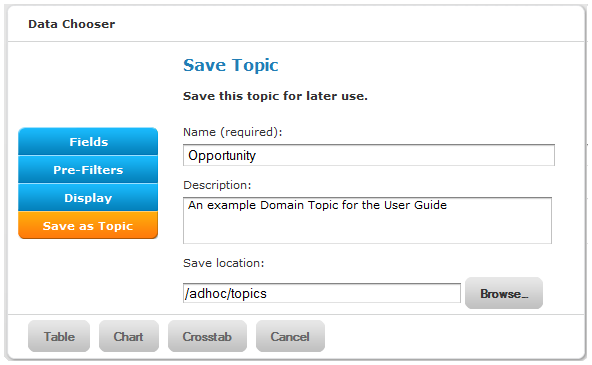
To save settings in the Data Chooser wizard as a Domain Topic:
| 1. | While making selections in the Data Chooser wizard, navigate to the Save Topic page. |
| 2. | Enter a Topic name and description: |
|
|
|
Information Needed for Saving a Domain Topic |
Do not change the location folder. The default /adhoc/topics folder makes the saved Domain Topic available on the Topics tab when you select Create > Ad Hoc Report.
| 3. | If your data selections, filter definitions, and display settings are complete, click Table, Chart, or Crosstab. |
|
|
If settings are incomplete, navigate to the other pages to finish, then click Table, Chart, or Crosstab |
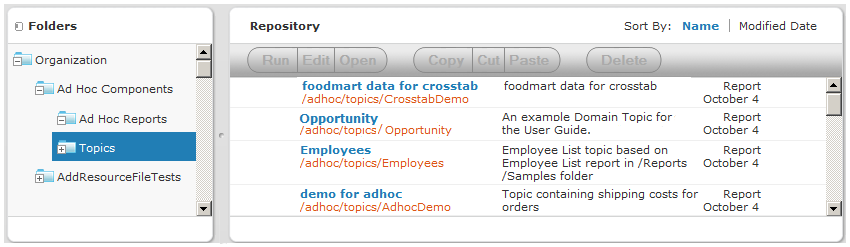
The new Topic appears in the Ad Hoc Components > Topics folder. While its repository type is Domain Topic, it appears when the Search page is filtered to show reports:
|
|
You can modify the Domain Topic you created using the Data Chooser wizard.
To edit the settings in a Domain Topic:
| 1. | Select View > Repository and search, or browse, for the Domain Topic you want to modify. |
Domain Topics are usually kept in the Ad Hoc Components > Topics folder.
| 2. | Right-click the Domain Topic and select Open in Designer from the context menu. |
The Domain Topic opens in the Data Chooser wizard:
|
|
|
The Simple Domain Topic in the Data Chooser Wizard |
| 3. | Follow the guidelines in section Using the Data Chooser Wizard to edit the Domain Topic as needed. |
| 4. | To save changes to the selected Domain Topic, click Table, Chart, or Crosstab on any page. |
|
|
Use caution when editing Domain Topics that may have been used to create reports. Users who relied on the Domain Topic might receive unexpected data or errors. It is safer to save changes as a new Domain Topic. |
To save changes as a new Domain Topic, navigate to the Save as Topic page and enter identifying information for the new Topic, then click Table, Chart, or Crosstab.