Crosstab of Foodmart Sales Totals by State and Product Family
You can use the Ad Hoc Editor to delve into the data and recognize trends and outliers by exploring and analyzing the data. The following example explores the state sales data in the Foodmart sample data that you can install with the server.
This section describes:
To set up the crosstab and define its initial layout:
| 1. | After logging into the server, click Create > Ad Hoc Report. |
The Data Chooser wizard appears.
| 2. | On the Topics tab, select foodmart data for crosstab and click Crosstab. |
The location of this Topic, typically in Ad Hoc Components/Topics, depends on your system configuration. The Ad Hoc Editor appears.
| 3. | Create a crosstab. Drag: |
• Store Country into the Column Group area.
• Store State into the Column Group area below Store Country.
• Product Family into the Row Group area.
• Customer State into the Row Group area to the right of Product Family.
• Store Sales into the Data Values area.
| 4. | Set the data format: right-click Store Sales in the Data Values label area and select Change Data Format > ($1234.56). |
| 5. | Right-click the Product Family row group label and select Expand Members. |
| 6. | Right-click the Store Country column group label and select Expand Members. |
| 7. | Review the data in the crosstab. Use the scroll bars if necessary. |
The Ad Hoc Editor displays a subset of the data by default; therefore, some rows and columns may not be displayed and value totals are small:
|
|
|
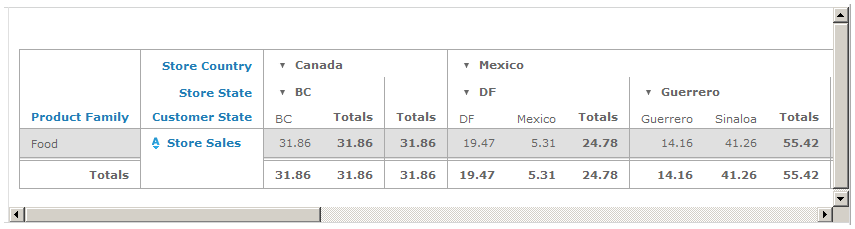
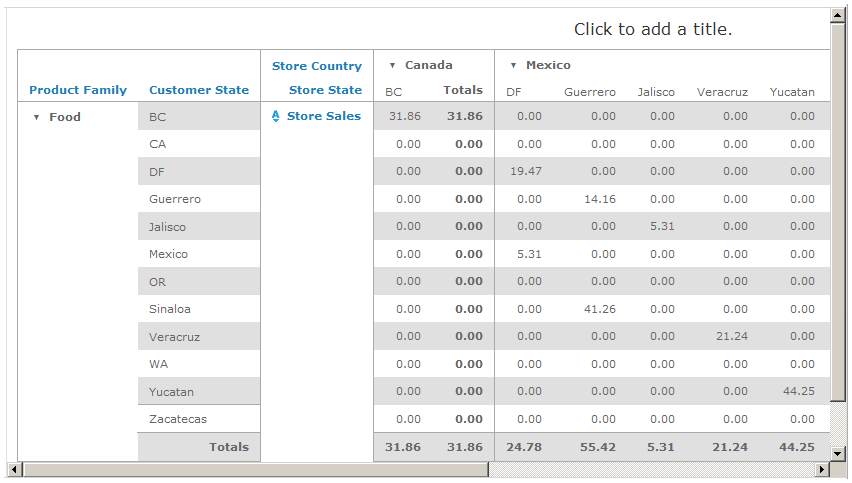
Crosstab of Foodmart Sales Totals by State and Product Family |
Even with the subset data, you can see many zero values. The non-zero values mainly appear in cells where the Store State column group intersects a Store Customer row for the same state. For example, in the BC column group, every cell shows a zero except for the first, where both the Store State column group and the Customer State row group are BC.
This indicates that most customers shop in their home state (the store state recorded for their purchases is the same as the customer’s home address state). There are exceptions, but they are obscured by all the zero values. You can make the crosstab more readable and compact by pivoting the Customer State row group so that all geographical groups are on the same axis of the crosstab.
| 8. | Right-click Customer State and select Switch to Column Group. |
| 9. | Right-click Store State and select Expand Members. |
Two column groups now show state names; one shows the store locations, the other shows the customer locations. None of the cells show a zero value, and the crosstab is more streamlined. Any case where stores recorded sales to customers from multiples states is evident from two or more customer states under the store state. The crosstab is easier to read:
|
|
Canada, BC is the only province that appears in either the Store State or Customer State: all the Canadian customers live in the same province as the store they frequent. The same is true in the US. But in Mexico, many customers cross state lines to shop. This seems like an important outlier.
In the next procedure, you focus on the data from Mexico. First, save the crosstab.
| 10. | Place the cursor over |
In See "Streamlined Crosstab of Foodmart Sales", you can see that Mexico has customers that travel outside their home states to shop. First, verify this trend across the full dataset, and if it holds true, then focus on the data in Mexico.
To view the full dataset and focus on specific group members:
| 1. | If the report from the last example isn’t open, locate the report in the repository, select the row that contains the report name, and choose Open in Designer from the context menu. |
| 2. | Click Full Data. The words Full Data appear color-coded to indicate that you are working with all the available data. |
Scroll in all directions to see the full data. Mexico is indeed the only country where stores record sales from customers living in other states.
| 3. | Right-click the Mexico column in the Store Country group and click Keep Only. |
The crosstab is redrawn without data from the US or Canada. Keeping or excluding group members is equivalent to filtering values from the data.
|
|
Because excluding columns is equivalent to filtering, the Ad Hoc editor reloads the data with this filter. If you are viewing a subset of the data, the filtering may change the subset, and therefore change the values you see. When viewing a full dataset, only the column or row totals are affected by row or column filters. |
The Ad Hoc Editor displays the filters pane with the filter equivalent to your selection of Store Country. However, you don’t need the filters pane and it takes up space on the page.
| 4. | In the filters pane, click |
This prevents the filters pane from appearing the next time you exclude group members.
Since the crosstab contains only a single country now, the two column group summaries show identical data.
| 5. | To hide the outermost column group summary, right-click Store Country and select Delete Column Summary. |
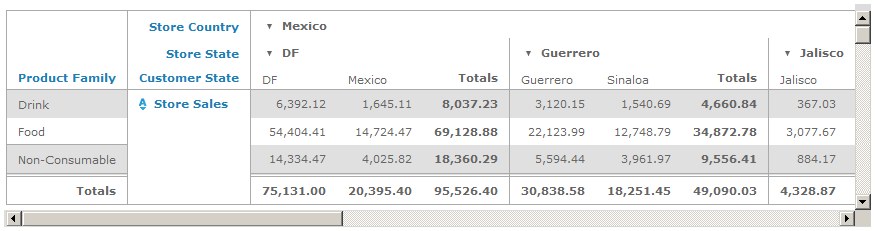
Let’s analyze the data appearing in the crosstab. Stores in DF (Distrito Federal) sell to customers in two states: DF and Mexico, which border each other. That seems trivial, but notice a similar issue in Guerrero: the Guerrero store is selling to customers in Sinaloa. Given that Sinaloa is hundreds of miles from Guerrero, this may be another important outlier. Several stores are much closer to Sinaloa than Guerrero.
Why are customers willing to drive so far to purchase from this location? Let’s take a look at the sales in stores nearer to Sinaloa: Distrito Federal, Jalisco, and Zacatecas.
| 6. | To remove the other columns, Control-right-click the header cells for Veracruz and Yucatan and select Exclude. |
The crosstab now shows all sales totals for Guerrero, where the Sinaloa residents are shopping, and for the three states with stores that are closer to Sinaloa. The crosstab is more compact and fits entirely on most screens:
|
|
|
Crosstab of Foodmart Sales in the Mexican States of Interest |
Now let’s add new measures that give us more insight into the data.
| 7. | In Fields, right-click Store Sales and select Create Custom Field. Select the advanced function, % of Column Group (value), then click Create Field. |
A new field appears in Fields: % CGP (Store Sales). CGP means column group parent. It compares values in column groups to their parent values and expresses each measure value as a percent of the containing column group.
Consider this example:
The total for CA sales is $1000.
SF sold $650, or 65% of the CA sales
LA sold $350, or 35% of the CA sales
These calculated fields can be used in crosstabs that include nested column and row groups; in this case the total for the inner group is expressed as a percent of the outer group total. % Column Group Parent can also be used in tables with more than one group.
To continue the above example:
The total for all states is $3000
The total for CA is $1000, or 33% of the US sales
The total for WA is $2000, or 66% of the US sales.
RGP means row group parent; it’s similar to CGP but applies to row groups rather than column groups. It compares values in row groups to their parent values and expresses each measure value as a percent of the containing row group.
Percent of parent fields can be used only as measures; placing them in a row or column group area has no effect.
| 8. | Right-click the new custom field and click Add as Measure. |
The measure appears in the crosstab. Let’s change the data format of the new measure to make it more readable.
| 9. | Right-click the measure’s label, click Change Data Format and select -1235. |
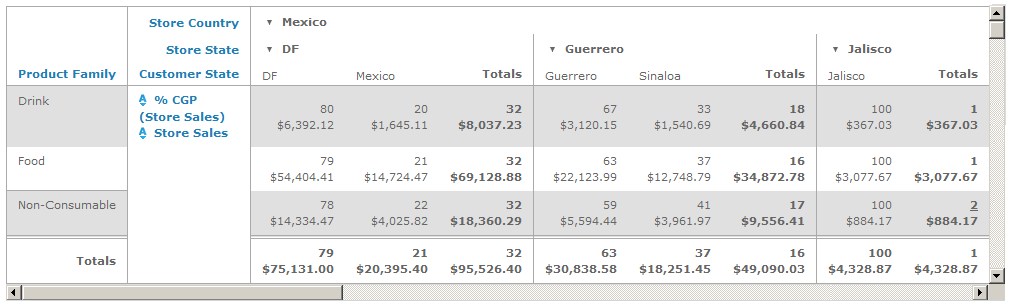
Now you can quickly scan the crosstab and see where the out-of-state buying is the highest, as a percentage of the total store sales. In this case, it is the Sinaloa residents purchasing non-consumables in Guerrero:
|
|
|
Crosstab of Foodmart Sales and Percent of Column Group Parent |
| 10. | Place the cursor over |
To refine the crosstab while viewing the full dataset:
| 1. | If it isn’t open, locate the report from the last example in the repository and click Open. |
Click the column group labels and select Expand Members to restore the view of the crosstab shown in See "Crosstab of Foodmart Sales and Percent of Column Group Parent".
| 2. | Sort by % CGP (Store Sales); click the sorting icon beside the measure label to change among the following sort orders: |
![]() Alphabetical order (A to Z) of the column and row group labels; this is the default sort order.
Alphabetical order (A to Z) of the column and row group labels; this is the default sort order.
![]() Numeric ascending order (smallest to greatest) of the column and row group summary values.
Numeric ascending order (smallest to greatest) of the column and row group summary values.
![]() Numeric descending order (greatest to smallest) of the column and row group summary values.
Numeric descending order (greatest to smallest) of the column and row group summary values.
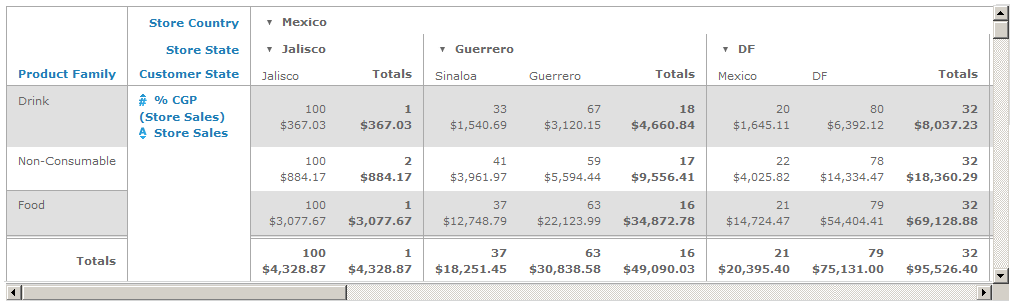
Both columns groups and row groups are sorted according to the chosen order, and inner groups are sorted within their parent groups:
|
|
|
Crosstab of Foodmart Sales |
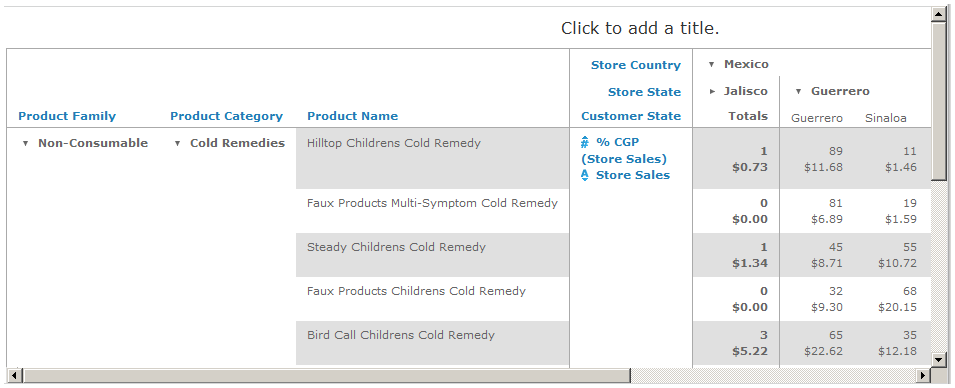
The percent of column group measure shows that a third of the people that shop for drinks in Guerrero live in Sinaloa. The non-consumable product family has even more customers from Sinaloa. Take a closer look.
| 3. | Right-click Non-Consumable and select Keep Only. |
| 4. | Click the arrow next to DF, Jalisco, and Zacatecas to collapse them. |
| 5. | For a breakdown of non-consumables, add Product Category as a row group to the right of Product Family. |
| 6. | Right-click Product Family and select Expand Members from the context menu. |
The crosstab shows two categories where more than 50% of the sales in the Guerrero store were made to residents of Sinaloa: Cold Remedies and Hygiene.
| 7. | Click Cold Remedies, Control-right-click Hygiene, and click Keep Only. |
|
|
Clicking the editor’s scroll bars removes the focus from groups selected in the crosstab. Select a member and use the mouse scroll button to scroll to the next member. |
| 8. | Review the data in the crosstab. Use the scroll bars if necessary. In the current view: |
• The measures show detail only for the Guerrero store; for the other states, the crosstab shows summarized values.
• For the % CGP measure, in Guerrero the detail for Sinaloa and Guerrero customers (47% and 53% respectively of all sales in Guerrero). In the Customer State total column, the % CGP is 13 - that is, $420.04 is 13% of all Mexican sales occurred in Guerrero.
At first glance, these numbers may seem incorrect; one might be expecting the % CGP values for Sinaloa and Guerrero customer state CGP values to roll up and equal the Guerrero CGP store state value. Instead, the Guerrero store state shows its percent of all of Mexico, and each of its customer states show the percent of store state. For more information, see Creating Custom Fields.
You can continue to refine the crosstab to understand why the Guerrero store is selling to customers in Sinaloa. The discrepancy is slightly greater in the Cold Remedies group member; focus on it first.
| 9. | Right-click Cold Remedies and select Keep Only. |
Hygiene is removed from the crosstab.
| 10. | Add Product Name as the inner-most row group. |
| 11. | Right-click Product Category and select Expand Members from the context menu. |
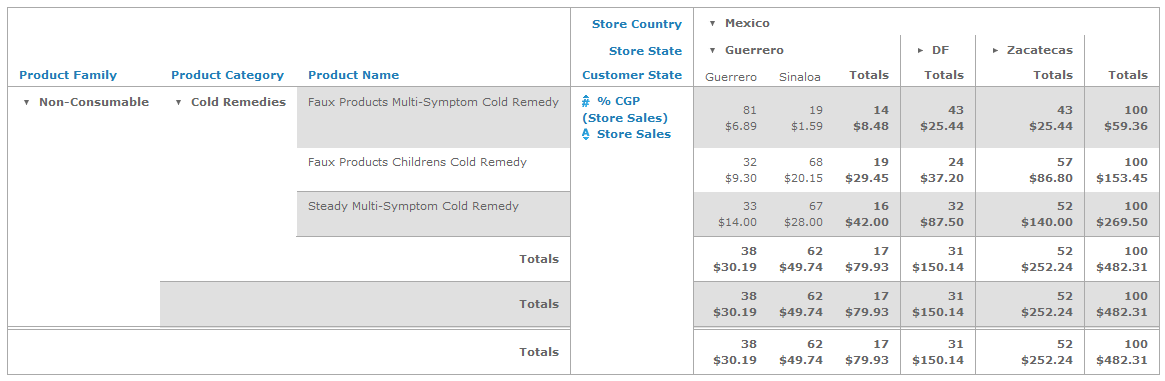
Several cold remedy brands sold mostly to Sinaloans (above 50% CGP) are selling poorly in Jalisco.
|
|
|
Cold Remedy Sales in DF, Guerrero, Jalisco, and Zacatecas |
| 12. | Note the cold remedies that are selling well to Sinaloans but not selling at all in Jalisco: Faux Products Childrens Cold Remedy, Faux Products Multi-Symptom Cold Remedy, and Steady Multi-Symptom Cold Remedy. |
| 13. | Click Faux Products Childrens Cold Remedy, Ctrl-click Faux Products Multi-Symptom Cold Remedy, control-right-click Steady Multi-Symptom Cold Remedy, then select Keep only. |
Notice that Jalisco disappears; that’s because these products have never been sold in Jalisco.
|
|
|
Jalisco Disappears From the Crosstab |
| 14. | Click |
| 15. | Instead of clicking |
If the filter pane is hidden, click ![]() to toggle visibility on.
to toggle visibility on.
| a. | Locate the Product Name filter and click the All check box to add all the cold remedies back into the crosstab. Jalisco is restored to the crosstab. |
When you click the All check box, the server retrieves all the values for the specified field and adds them to the filter. When the report is run, the values the server retrieves are used to filter the report. The server does not retrieve a list of new valid values at run-time. For more information, see Using Input Controls and Filters.
To ensure that all values are included in a report at run-time, remove the filter.
| 16. | Place the cursor over |
|
|
|
Crosstab of Cold Remedies sold in Mexico |
| 17. | To continue further analysis, click the Product Category total for Guerrero ($314.61) to open a new instance of the Ad Hoc Editor. |
| 18. | Click Crosstab to continue data exploration or Chart to create a compelling visualization of the data. |
In the above example, you explored the Foodmart dataset and analyzed an interesting outlier: Sinaloans are willing to bypass a closer store (in Jalisco) in order to buy a few brands of cold remedy (Faux Products Childrens Cold Remedy, Faux Products Multi-Symptom Cold Remedy, and Steady Multi-Symptom Cold Remedy). Further analysis might reveal an underlying cause:
• Are these brands being regularly stocked in Jalisco, or is there a supply chain problem at this location?
• Are other factors contributing to the discrepancy, such as the age or gender of the customer?
• Is this an isolated incident or a growing trend? If it’s a trend, what common characteristics of the customers or products are involved?
• Are the data for hygiene products similar to the data for cold remedies? Do any of the similarities shed light on the issue?
You can use the same techniques discussed in this section to analyze and explore your own data in the Ad Hoc Editor.