Using the JasperReports Server Plug-in for iReport
The server plug-in for iReport provides report developers with a quick and easy way to access reports inside the server repository. The plug-in uses web services to interact with the server, and you can connect to multiple servers. This can make it easy to access both test and production environments.
|

|
This section assumes that you installed iReport when you installed the server. For more information, refer to section 14.2, “iReport Designer Plug-ins,” on page 320.
JasperReports Server 4.0 supports iReport 4.0 or higher and JasperReports 4.0 or higher
|
The plug-in offers these features:
• Browse the repository.
• Create, modify, and delete folders, generic resources (including images, fonts, JRXML files, JAR files, and property files), reports, datatypes, list of values, and input controls.
• Create, modify, and import data sources (JDBC, JNDI, and JavaBean).
• Add, remove, and link controls to reports.
• Drag and drop images and sub-reports into the design page.
• Access Domains through the Domains plug-in for iReport.
This section includes these topics:
• Connecting to the Server from iReport
• Creating a Report Unit in the Repository from iReport
• Managing Resources in the Repository from iReport
• Editing a Report in the Repository from iReport
• Running a Report from iReport
• Creating Reports in iReport Based on a Domain in the Server
• Creating Chart Themes in iReport
Connecting to the Server from iReport
You can connect to JasperReports Server directly from iReport.
To access the server repository within iReport:
|
1.
|
Start iReport. For example, if you are on a Windows computer hosting JasperReports Server, select Start > Programs > JasperReports Server > Start iReport Designer. |
iReport appears.
|
2.
|
Open the JasperReports Server Plug-in for iReport by clicking Window > JasperReports Server Repository. |
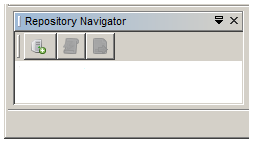
The Repository Navigator tool bar appears:
|
3.
|
On initial startup of iReport, no servers are configured. To add a server, click the first button in the repository navigator tool bar. |
|
4.
|
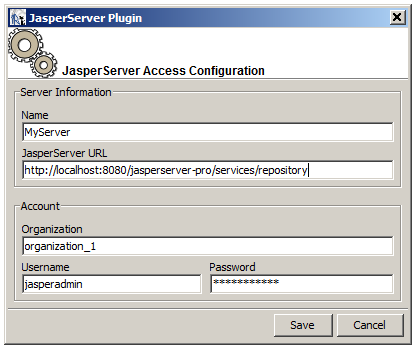
Enter the information for the plug-in to use to access your server instance. All fields are required: |
• Name – An identifier for this server instance and its repository in the iReport Repository Navigator.
• JasperServer URL – Full URL to the repository web service; the default URL is provided and you only need to change the hostname.
• Organization – If there is more than one organization in the server instance, you must specify the ID or the alias of the user’s organization, for example organization_1. In the default installation with a single organization, you can leave this field blank.
• Username – ID of the user account to use when accessing the server. The view of the repository and any actions you take through iReport uses the permissions for this user.
• Password – The password for the given user.
|
5.
|
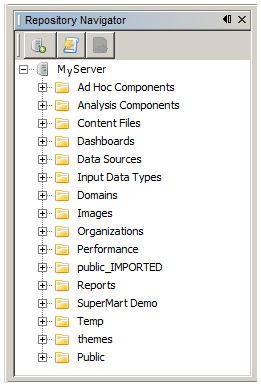
Click Save, then expand the repository tree in the Repository Navigator. The server repository tree appears as it would to the user in the given organization. |
You can add any number of servers to this list. If you have multiple versions of the plug-in installed, the list includes all the servers configured for every version later than 3.1 of iReport that is installed on this computer. Note that you may experience problems when connecting to servers that are not compatible with your version of the plug-in.
For each server to which you have configured access in the JasperReports Server Plug-in, you can:
• Browse the repository by double-clicking the server and folder icons.
• View the property information of the resources in the repository.
• Download, edit, and upload JRXML files.
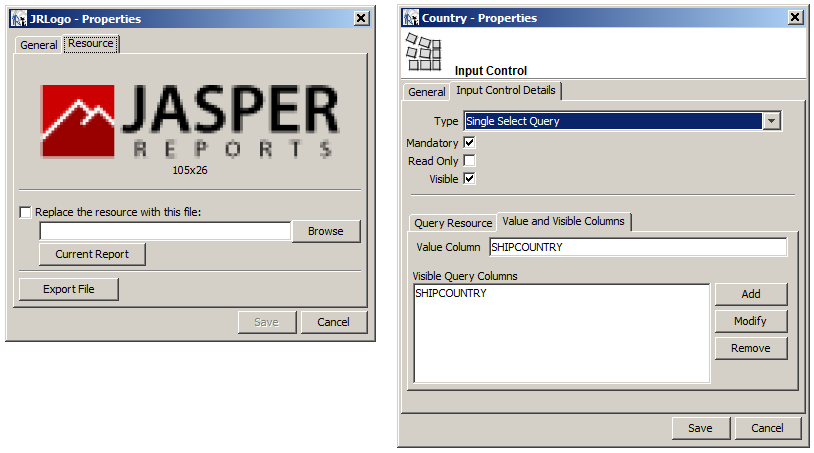
• Download images and other files by clicking Export File on the Resources tab of the resource’s Properties window.
Creating a Report Unit in the Repository from iReport
To add a new report unit, you need a JRXML file, which you can create in iReport beforehand. A report has a main JRXML file, a data source, a set of input controls (zero or more), and a set of resources (zero or more). To create a report that returns data from a Domain, see section Creating Reports in iReport Based on a Domain in the Server.
To create a report unit in the repository:
|
1.
|
Right-click the parent folder for the new report and click Add > Report Unit in the context menu. |
You are prompted for the name and label of the main JRXML file.
|
2.
|
Click Next, and then select a JRXML file in the repository or on the hard drive. If you have a report open in the design area, select Locally Defined and click Get source from current opened report to use it in the new report unit. |
You are prompted for the data source.
|
4.
|
Select a valid data source (either from the repository or locally defined) and click Finish. |
|
5.
|
The report unit appears in the repository tree. If it doesn’t, right-click the server name and select Refresh from the context menu. |
|
6.
|
To add an image from the repository to a report, drag the image into the design window from the repository tree. |
The iReport plug-in adds the image element for you, setting an expression that refers to the image’s location in the repository.
|
7.
|
To add a subreport to a report, drag the JRXML for the subreport from the repository to the detail band. The JRXML for the subreport must already be created and saved as a resource in the repository or in the report. |
A subreport element is created. If the main report uses a JDBC connection, set the connection expression of the subreport to $P{REPORT_CONNECTION} in the subreport tab of the Properties window.
|

|
You cannot run a subreport directly on the server; you must run the entire report unit.
|
|
8.
|
To run the report, right-click the report unit and select run Report Unit from the context menu. For more information, refer to section Running a Report from iReport. |
|

|
When you upload a report that uses the repo: syntax to refer to resources in the repository, iReport prompts you to locate the resources. Browse the repository to find the correct resource and click OK. For more information, refer to the JasperReports Server Ultimate Guide.
|
Managing Resources in the Repository from iReport
While creating reports that you intend to store in the repository, you also need to create and manage the resources associated with them, such as images, JARs, JRXML files, properties files for localized reports, input controls, datatypes, lists of values, style templates (JRTX), and data sources. If you are maintaining existing reports, you may need to access, modify, and save changes to existing resources. You can also modify the location, name, or description of the repository folders.
To add, modify, or delete resources to the repository from iReport:
|
1.
|
To add resources in the repository navigator, right-click a folder, select Add, and then click the desired object in the context menu. |
|
2.
|
To change the location of a resource in the repository, locate the object, then drag-and-drop it to the new location. |
Alternatively, right-click the object and select Copy or Cut, or use the keyboard shortcuts: Ctrl-C and Ctrl-X, respectively. Locate the destination, right-click, and select Paste, or use the keyboard shortcut Control-V. When cutting the object, it is not removed from its original location until pasted in the new location.
|
3.
|
To delete a resource from the repository, locate the object, right-click it, and select Delete. You must confirm your action to prevent accidental deletions. |
|
4.
|
To modify a resource, navigate the repository tree to find its folder, then right-click the resource and select Properties. |
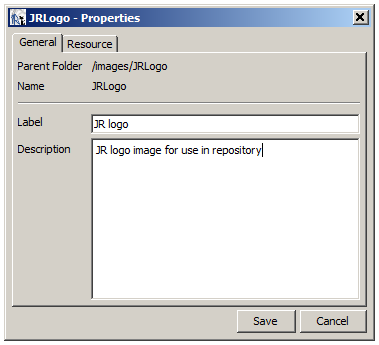
In the Properties dialog box that appears, there are one or more tabs depending on the type of resource:
|
5.
|
On the General tab, view the object’s repository label and description. |
|

|
If you are logged in as an administrator, you can modify property values and save them back to the Repository.
|
Tabs other than General, if there are any, contain controls that are specific to each type of resource. File-based resources have a Resource tab to replace or export the file, and other repository objects have their own specific settings.
As shown in See "Editing Resource-Specific Properties of Repository Objects in iReport", the image appears on the Resource tab of the image properties, and you can replace the image from this tab.
You can change an input control from the Input Control Details tab:
|
6.
|
Click Save in the Properties dialog box to make the changes effective in the repository. |
Editing a Report in the Repository from iReport
In the repository tree, the  icon indicates a report unit, and
  indicates a JRXML file. When you work with a JRXML file in the Repository from iReport, iReport operates on a copy of the file. You must upload the JRXML file back to the repository when finished, as explained in the following procedure:
To edit a JRXML file in the Repository from iReport:
|
1.
|
In the repository tree, right-click the JRXML file in the report unit and select Open in Editor. |
The JRXML is extracted from the repository and stored as a local copy in the <USER_HOME>/.ireport/jstmp directory. This directory is never automatically cleared out.
The JRXML appears in the Designer window.
|
3.
|
To save the file and upload it to the repository, right-click the file in the repository tree and click Replace with Current JRXML. |
A message confirms the operation’s success.
To edit a Report Unit in the Repository from iReport:
|
1.
|
In the repository tree, right-click the report unit and select Properties. |
|
2.
|
On the General tab, change the repository name or description as appropriate. |
|
3.
|
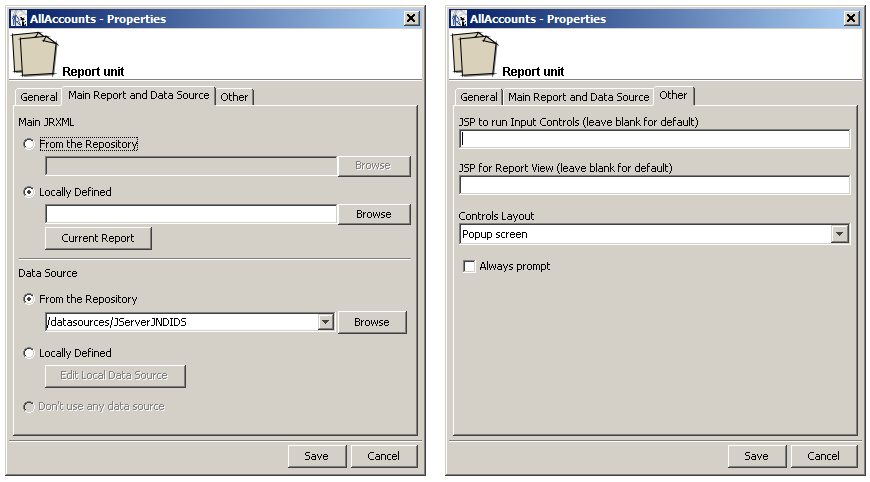
On the Main Report and Data Source tab, you can change the JRXML file for the report, either by selecting one from the repository, or uploading one through iReport. Click Current Report to use the JRXML currently being edited in iReport. Similarly, you can select the data source from the repository or from iReport. See Editing Parameters of a Report Unit in iReport. |
|
4.
|
On the Other tab, you can set display properties for any input controls. |
|
5.
|
On the JSP fields you can modify the appearance of the controls. |
The Controls Layout determines where they appear:
|
6.
|
Click Save to make the changes effective in the repository. |
Running a Report from iReport
To run a report on the server using all the export options set in iReport:
|
1.
|
Right-click a report in the repository tree and click Run Report Unit. |
|
2.
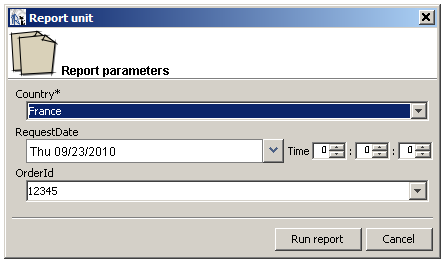
|
If the report has input controls, the Report Parameters window prompts you for values: |
The report is displayed in the Report Viewer Window. If the report does not display, look for errors or messages in the Report Problems Window at the bottom of the iReport interface.
Creating Reports in iReport Based on a Domain in the Server
A Domain is a virtual view of a data source that represents the data in business terms appropriate to your audience, and it limits the data to that which is appropriate for the audience. For more information about Domains, see Chapter 6, “Creating Domains,” on page 135.
The Domain plug-in enables iReport users to generate reports from Domains. The plug-in is installed in iReport Professional by default. It relies on the JasperReports Server plug-in to access the repository.
To create a report in iReport based on a Domain in the server:
|
2.
|
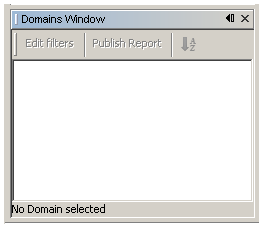
Click Window > Domains. |
The Domain Window appears docked on the left-hand side of the screen:
|
3.
|
To start a report based on a Domain, click File > New. In the New file window, click Domain Report. |
|
4.
|
Accept the default, Blank A4, for the report size, and click Finish. |
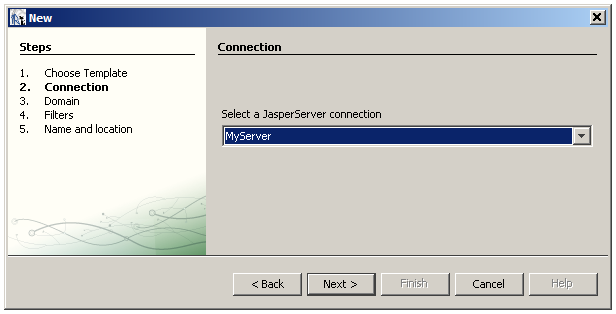
The Domain Report wizard opens to the Connection step:
|
5.
|
Select a connection to a JasperReports Server, then click Next. |
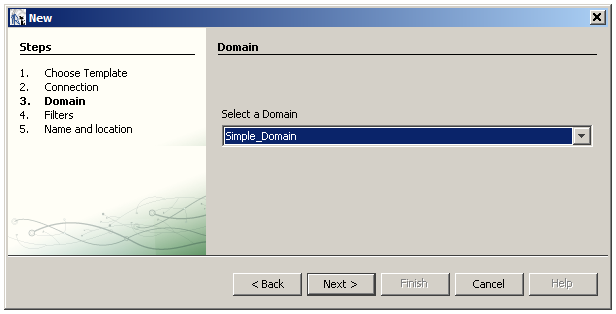
The Domain step displays a selector containing all the Domains within the repository visible to the user defined in the connection. If the user’s organization includes a sub-organization, the list includes any Domains they define as well.
|
6.
|
Select a Domain. For example, accept the default Domain, Simple_Domain, and click Next. |
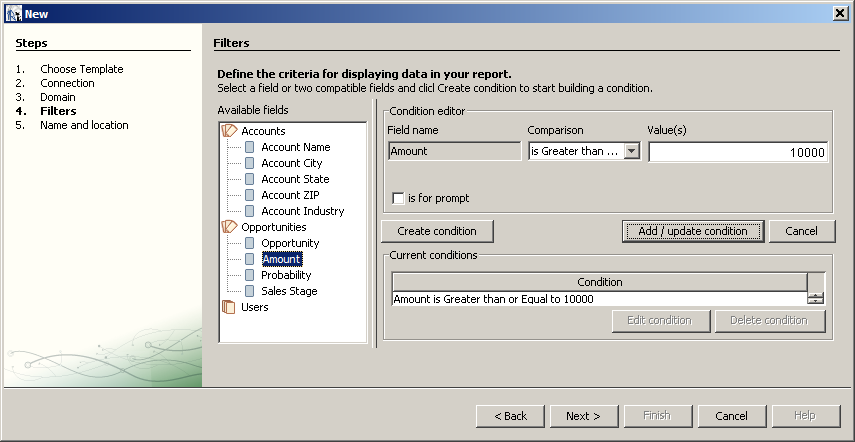
The Filters step displays the Domain’s items, which may correspond to fields and calculated fields in the Domain.
|
7.
|
Define any necessary filter conditions to apply to the fields of the Domain. For example, expand Opportunities, double-click Amount. In the Condition editor, select is Greater than or equal to. Enter the value 10000, and click Add/Update condition. |
Even if that field is not included in the report, the filter is active and is applied to the rows of data that appear. Filters limit the data the report returns, and you may select any field to prompt the user with an input control. This page is similar to the Filters page in the Data Chooser wizard within the server. For more information, see section The Pre-filters Page.
|
8.
|
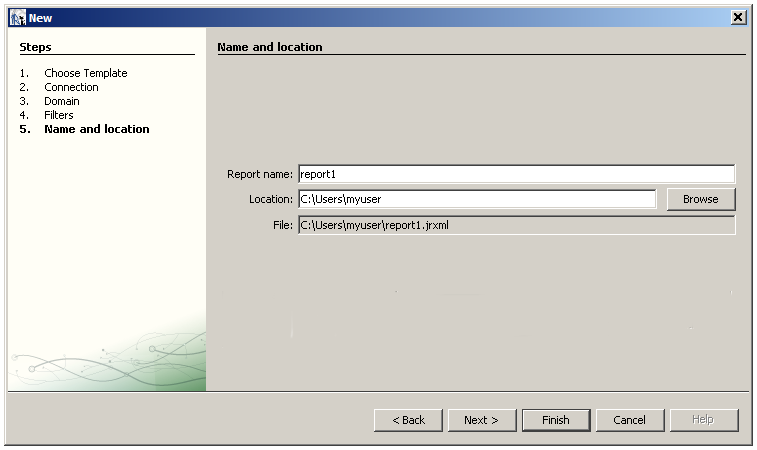
Click Next and specify a name and a location on the hard drive to save the report. |
The Name and Location step determines the file name of the report in iReport, not in the JasperReports Server repository. Perform See "When you are satisfied with the report, save the report, then click Publish Report in the Domain window." to See "Select a valid repository location and click Finish." to publish the report in the repository.
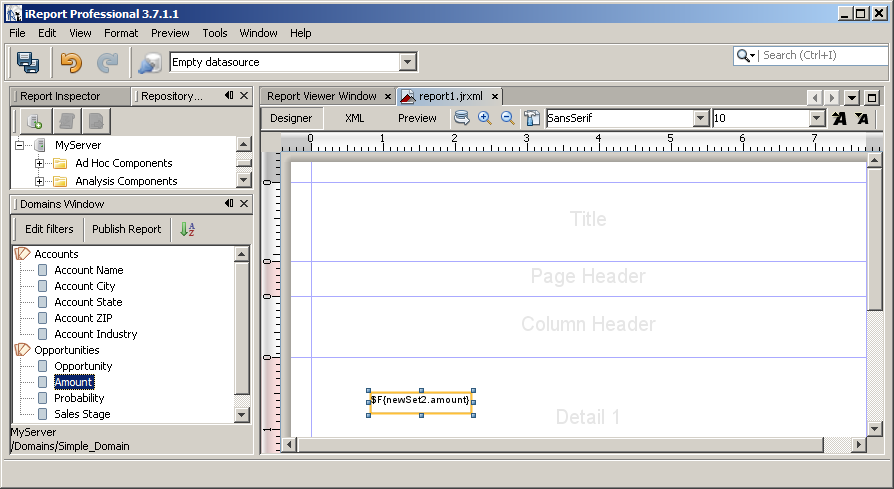
The report document appears in design area. The Domain Window now shows the sets and items in the Domain.
|
10.
|
To add items from the Domain, drag them to the detail area of the JRXML in the designer. Edit the report to format its data and its look and feel. |
If you want to change the filters on the Domain data, click Edit Filters in the Domains Window. Filters are defined as queryFilterString elements in the XML of the report. Click XML next to Designer to view the XML. For the simple filter shown in See "Define any necessary filter conditions to apply to the fields of the Domain. For example, expand Opportunities, double-click Amount. In the Condition editor, select is Greater than or equal to. Enter the value 10000, and click Add/Update condition. ", the generated XML is the following:
|
<queryString language="domain">
<![CDATA[<query>
<queryFields>
<queryField id="newSet2.amount"/>
</queryFields>
<queryFilterString>newSet2.amount >= 10000</queryFilterString>
</query>]]>
</queryString>
|
The query has two elements: queryFields and queryFilterString:
• Field IDs in both elements are specified as set_ID.field_ID.
• The filter uses the Domain Expression Language described in section The DomEL Syntax.
|
11.
|
When you are satisfied with the report, save the report, then click Publish Report in the Domain window. |
You are prompted for a name, label, and description of the new report unit.
|
12.
|
Enter a name (object ID), label (display name), and an optional description for the report in the repository, then click Next. |
You are prompted for a location for the report unit.
|
13.
|
Select a valid repository location and click Finish. |
|
14.
|
If the report doesn’t appear in the repository tree, right-click the server name and click Refresh. |
|
15.
|
With the report published to the server, you can test it by clicking  in the repository navigator window. in the repository navigator window. |
The report output appears in the Report Viewer Window.
|

|
You cannot run a Domain report until it has been published to the server.
|
Creating Chart Themes in iReport
Using iReport, you can create new chart themes that give a custom look to any chart. You can easily set the fonts, colors, line widths, and other settings that determine the appearance of charts. You can then import the chart theme for use in reports generated in the server, either on a report-by-report basis or as a global setting for all charts that do not provide their own theme.
To create a new chart theme in iReport:
|
1.
|
Select File > New > Chart Theme and click Finish. |
The new file dialog box opens with a default file name. Chart themes use the .jrctx file extension.
|
2.
|
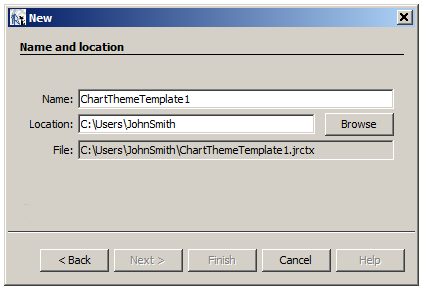
Enter a name and location and click Finish. |
Alternatively, open an existing chart theme file with the .jrctx extension.
The chart theme editor appears in the Designer window.
|
3.
|
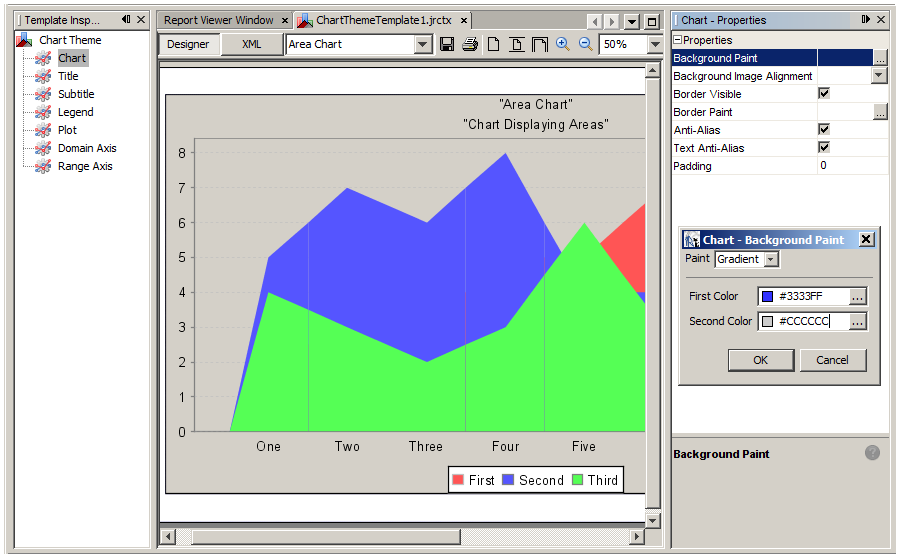
Maximize and pin, if necessary, the following panes, which you use together to work with the chart theme: |
• Template Inspector on the left – Select a category of properties.
• Properties on the right – View and change properties.
If the panes are not open, select Window > Template Inspector and Window > Properties.
These panes are shown in Chart Theme Editor in iReport.
The available options are based on the JFreeChart library used to generate charts. Note that iReport supports only the most common options provided by JFreeCharts.
|
4.
|
Select each category in the template inspector and review the available options, which appear in the properties pane to the right. |
|
5.
|
Select a property to change its value. Depending on the nature of the property, you might type text, select a color, check or clear a check box, or select a value from a dropdown. |
As you update the chart theme, the Designer shows your changes. For example, change the Series Color property in the Plot category to set the color of the data series in the chart.
Select different chart types from the drop-down to see how the theme appears with different types of charts. This is especially important if you are creating a theme for use with many reports, such as a corporate chart theme.
To view the XML that defines the chart theme’s appearance, click XML.
|
6.
|
When you are satisfied with the chart theme, click File > Save to save the chart theme. |
This saves the report to your local hard drive.
|
7.
|
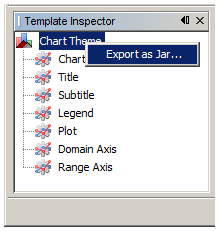
In the template inspector, right-click Chart Theme and click Export as Jar from the context menu: |
You are prompted to identify the chart theme.
|
8.
|
Enter the name of the theme and the name of the JAR file. |
The chart theme name is the text that appears in the Chart Theme drop-down in iReport’s properties pane.
If you don’t want this theme to be available in iReport for some reason, clear the check box.
|
9.
|
Leave the box checked if you want the JAR to be placed on iReport’s classpath. |
The chart theme is exported. The theme can be used at the report or server level in JasperReports Server. For more information, refer to the JasperReports Server Administrator Guide.
|

|
In iReport, you can upload the chart theme to the server using the JasperReports Server plug-in; right-click the folder in the repository where the theme should reside, and select Add > JAR Archive.
|
![]()
